Geoscience data and AI prospectivity mapping for mineral exploration.
From country-scale geology and open ground to ranked targets, using published geochemistry, geophysics, satellite imagery and machine learning.
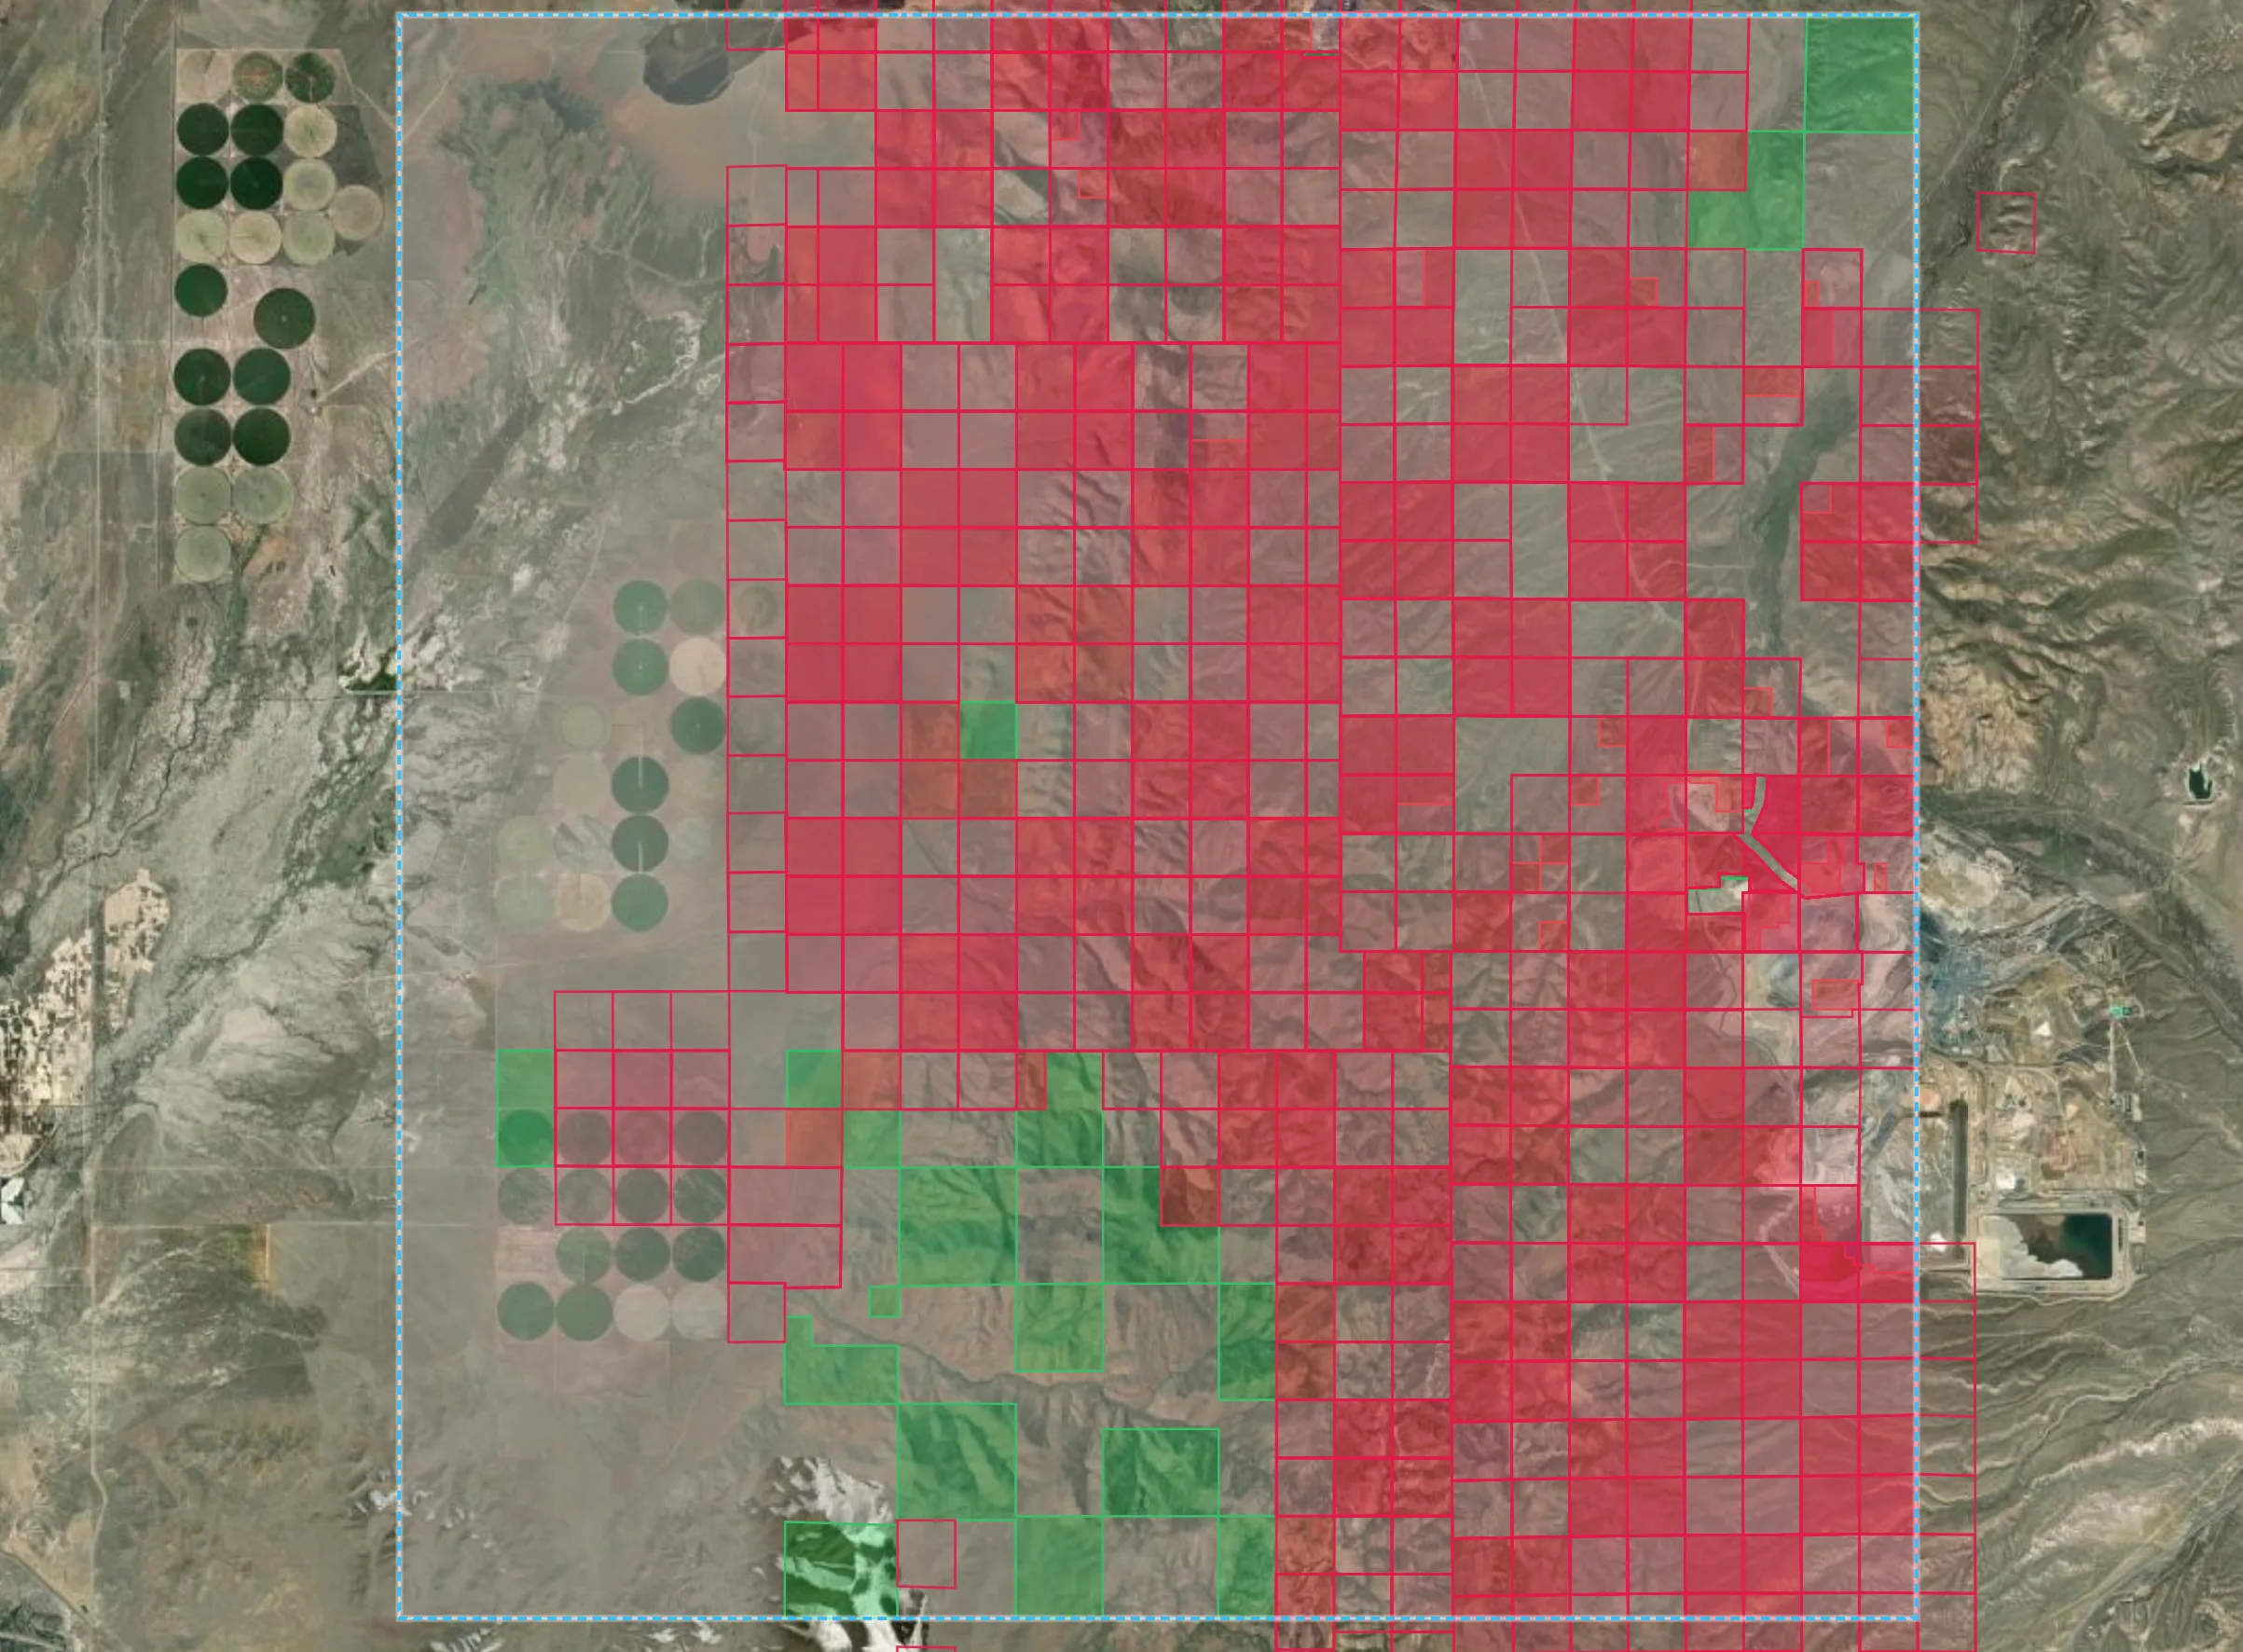
- Open ground: tenure registers of 55 jurisdictions, read to show the ground no one holds.
- Prospectivity models: 51 minerals ranked, with the reasoning behind every score.
- Ranked targets in Australia, the United States and Canada; a global model everywhere else.
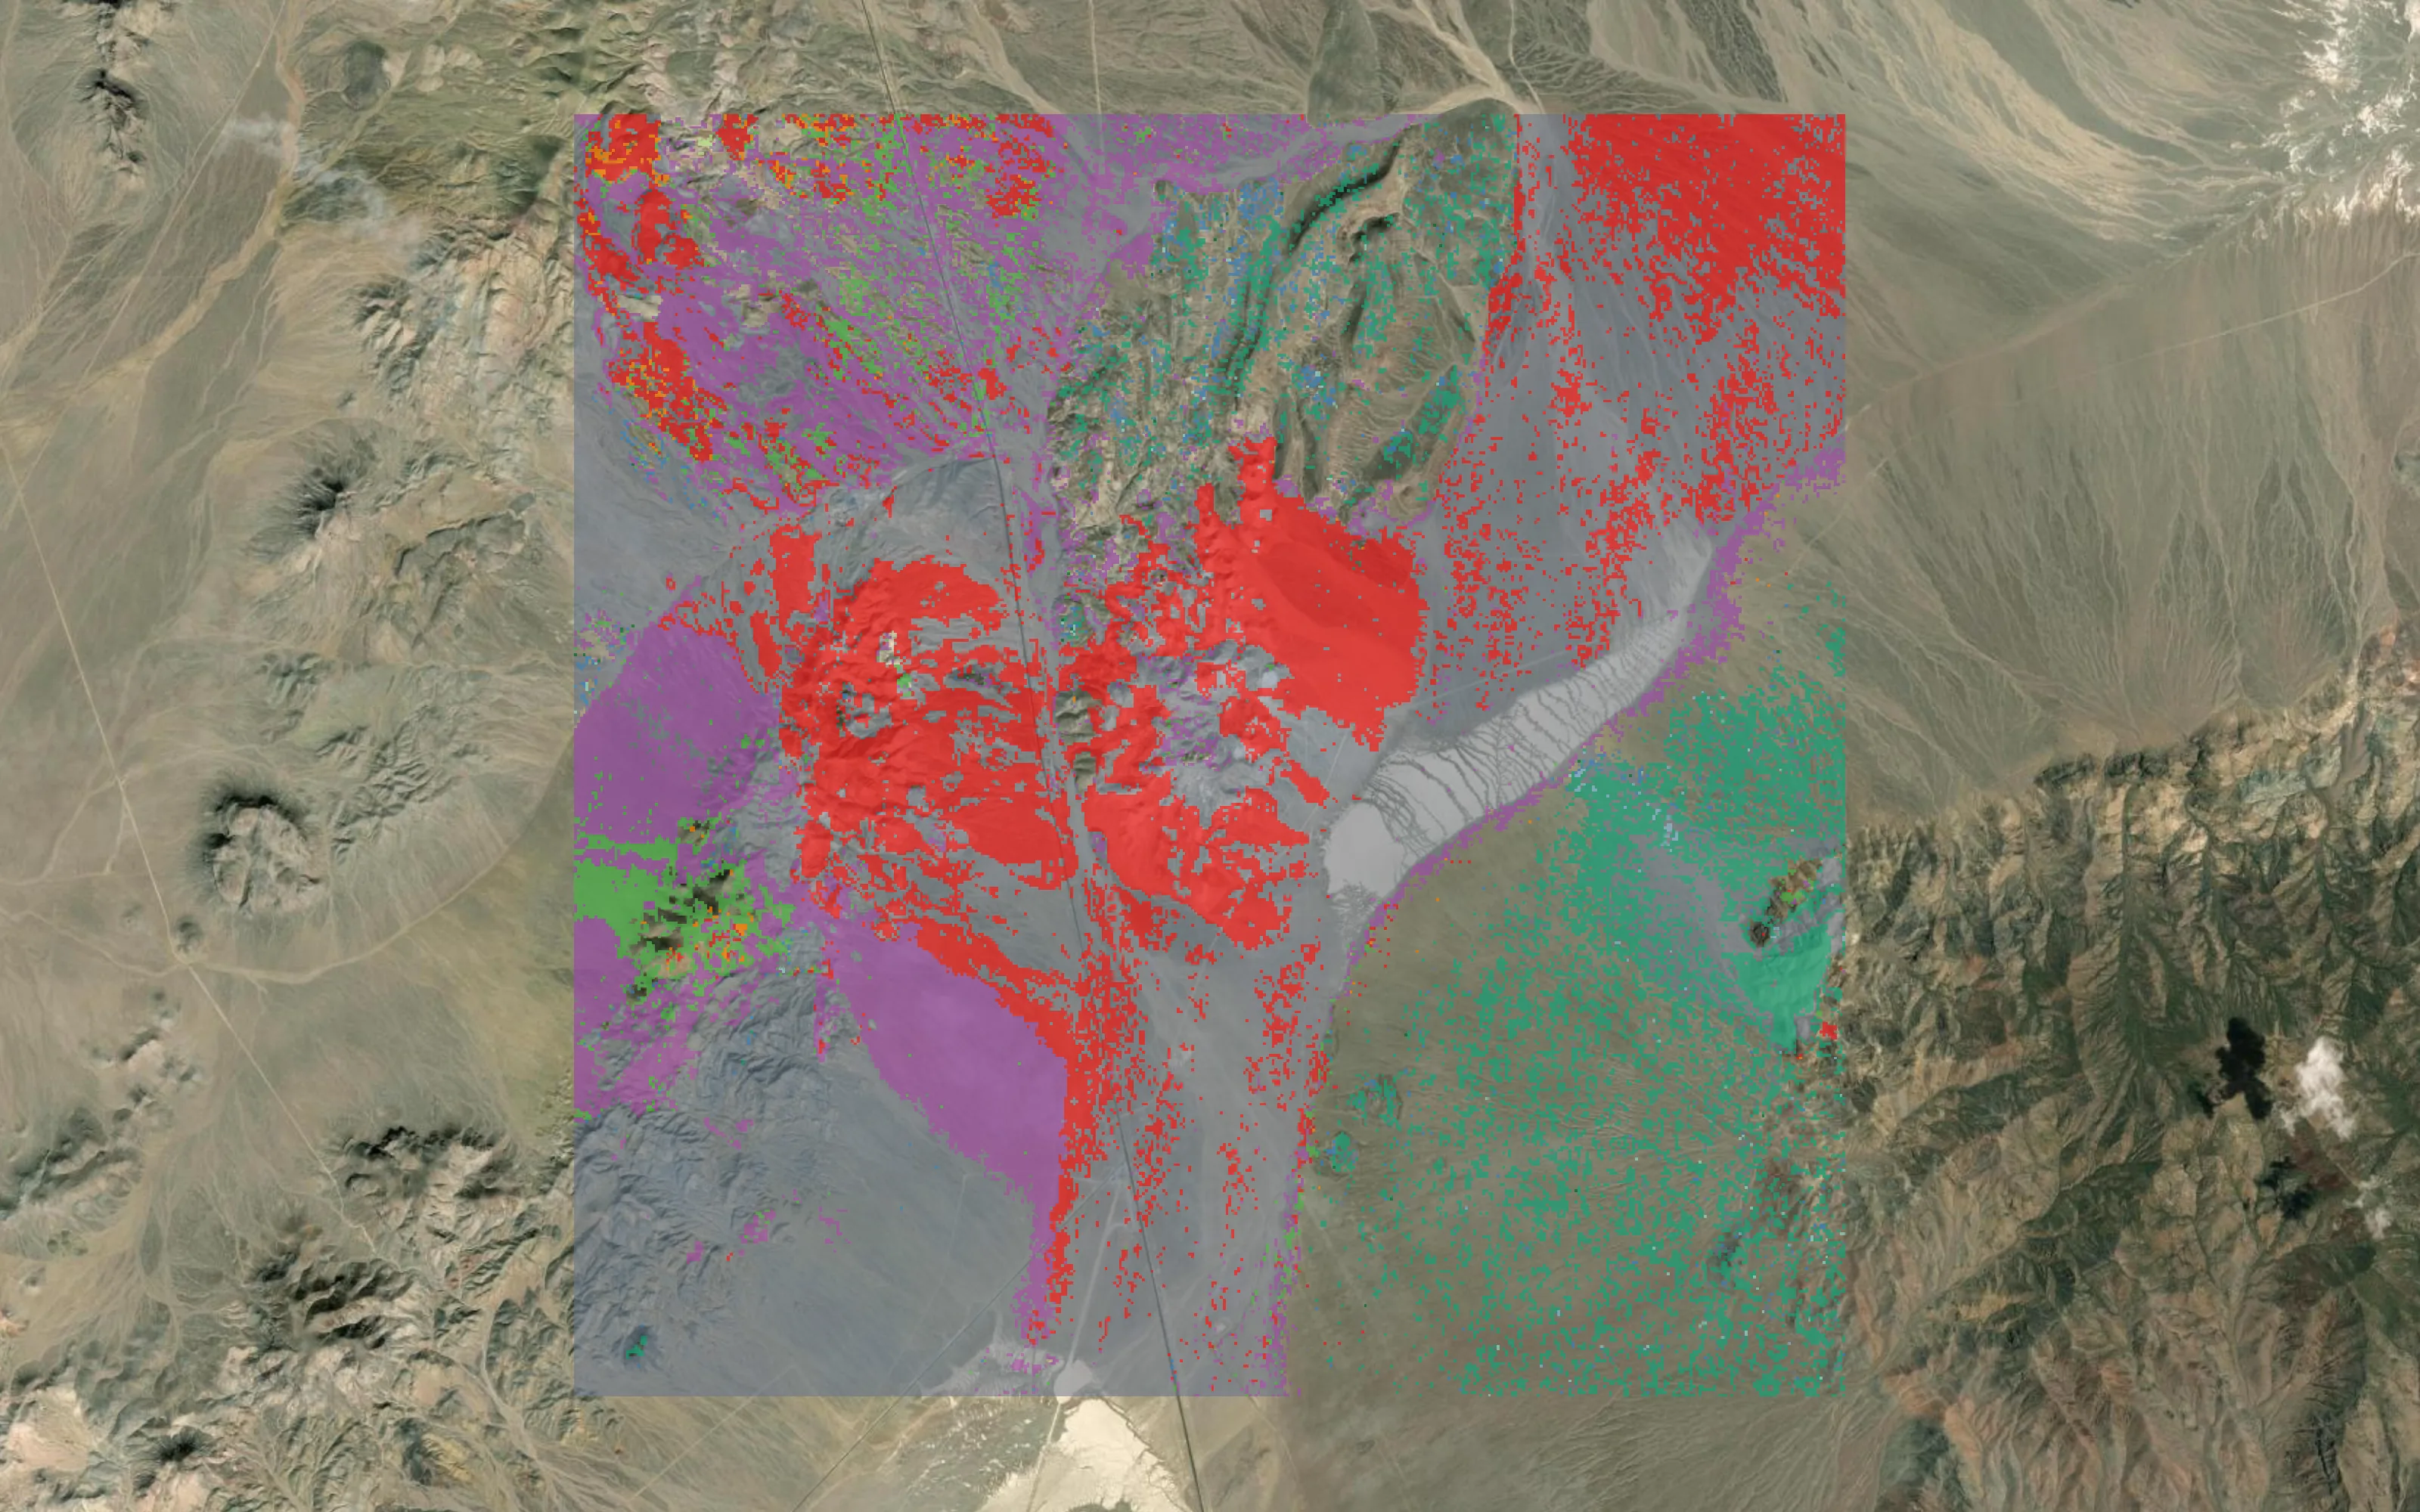
- Spectral mapping: alteration minerals from satellite, regional to camp scale, including WorldView-3.
- Due diligence: tenure, land access and the real cost to hold and drill.
- The record: over 200 million published sample records from 162 sources.
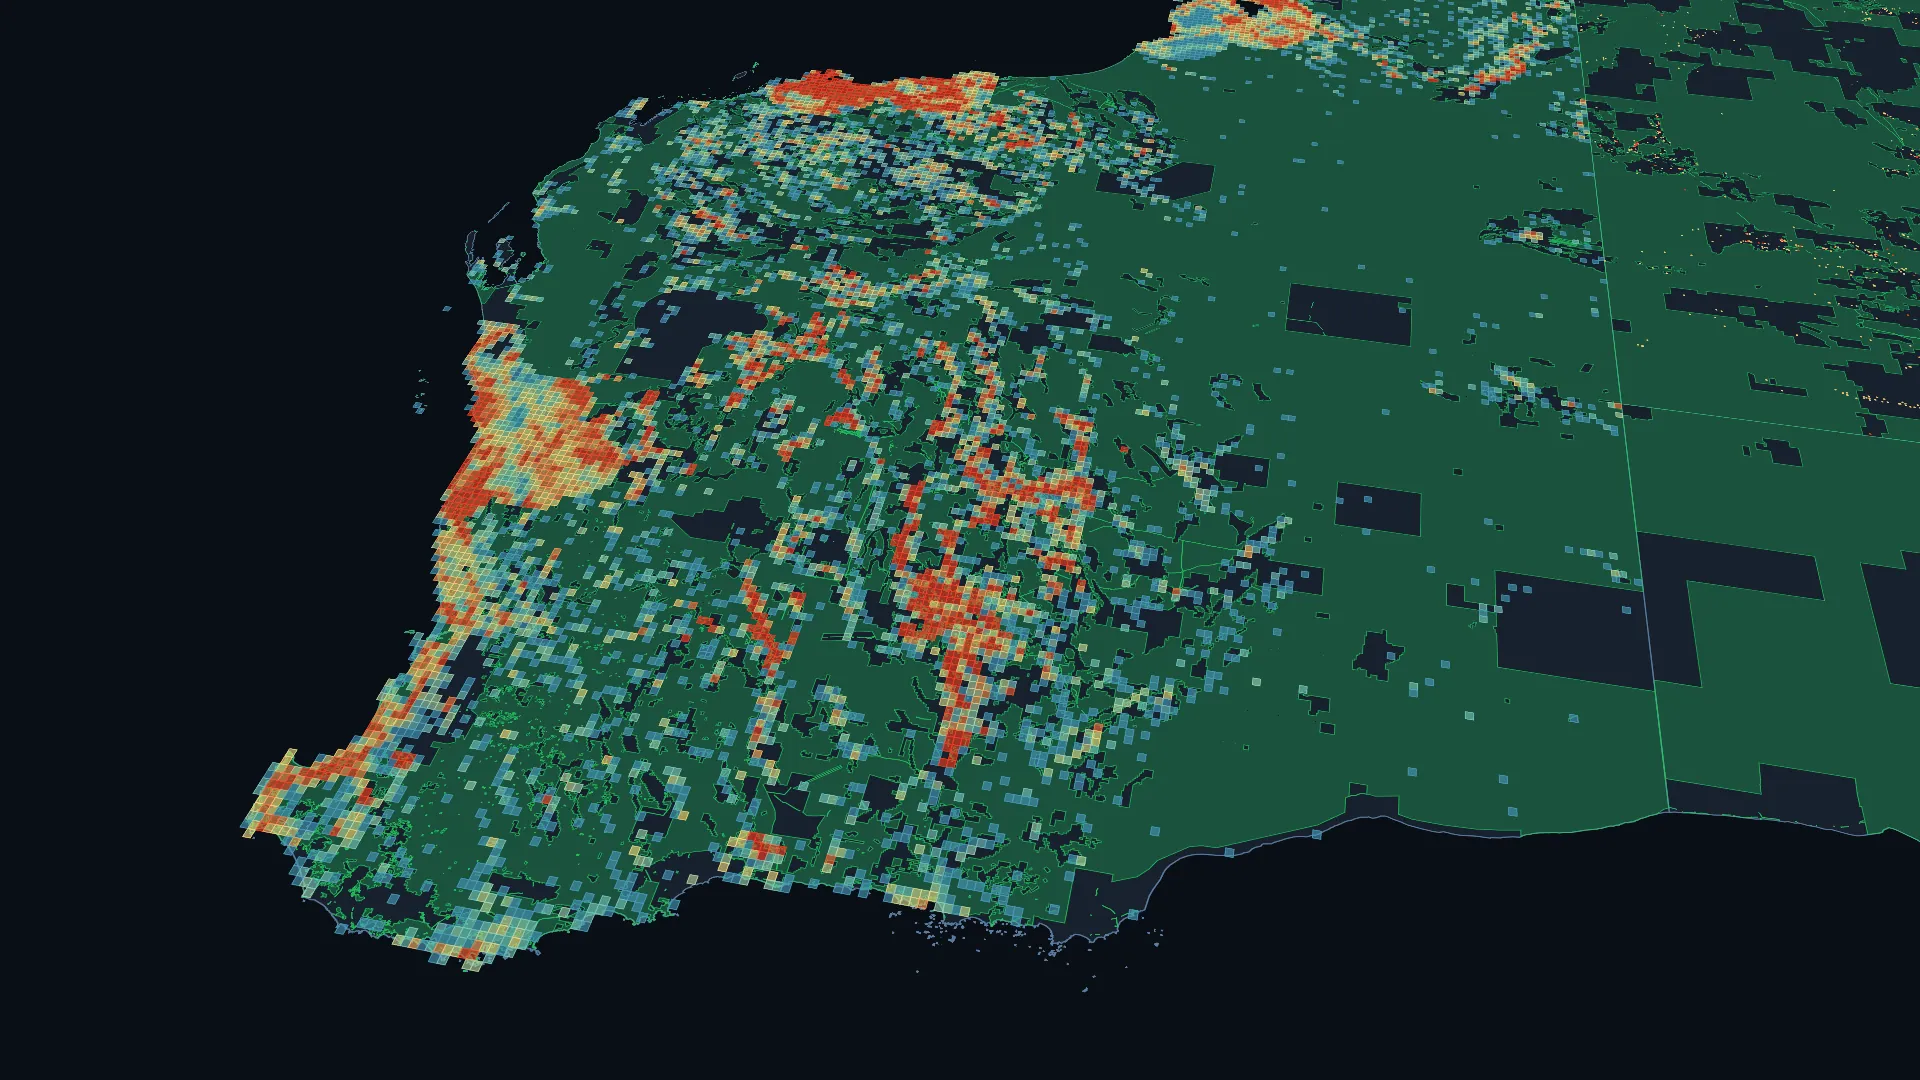
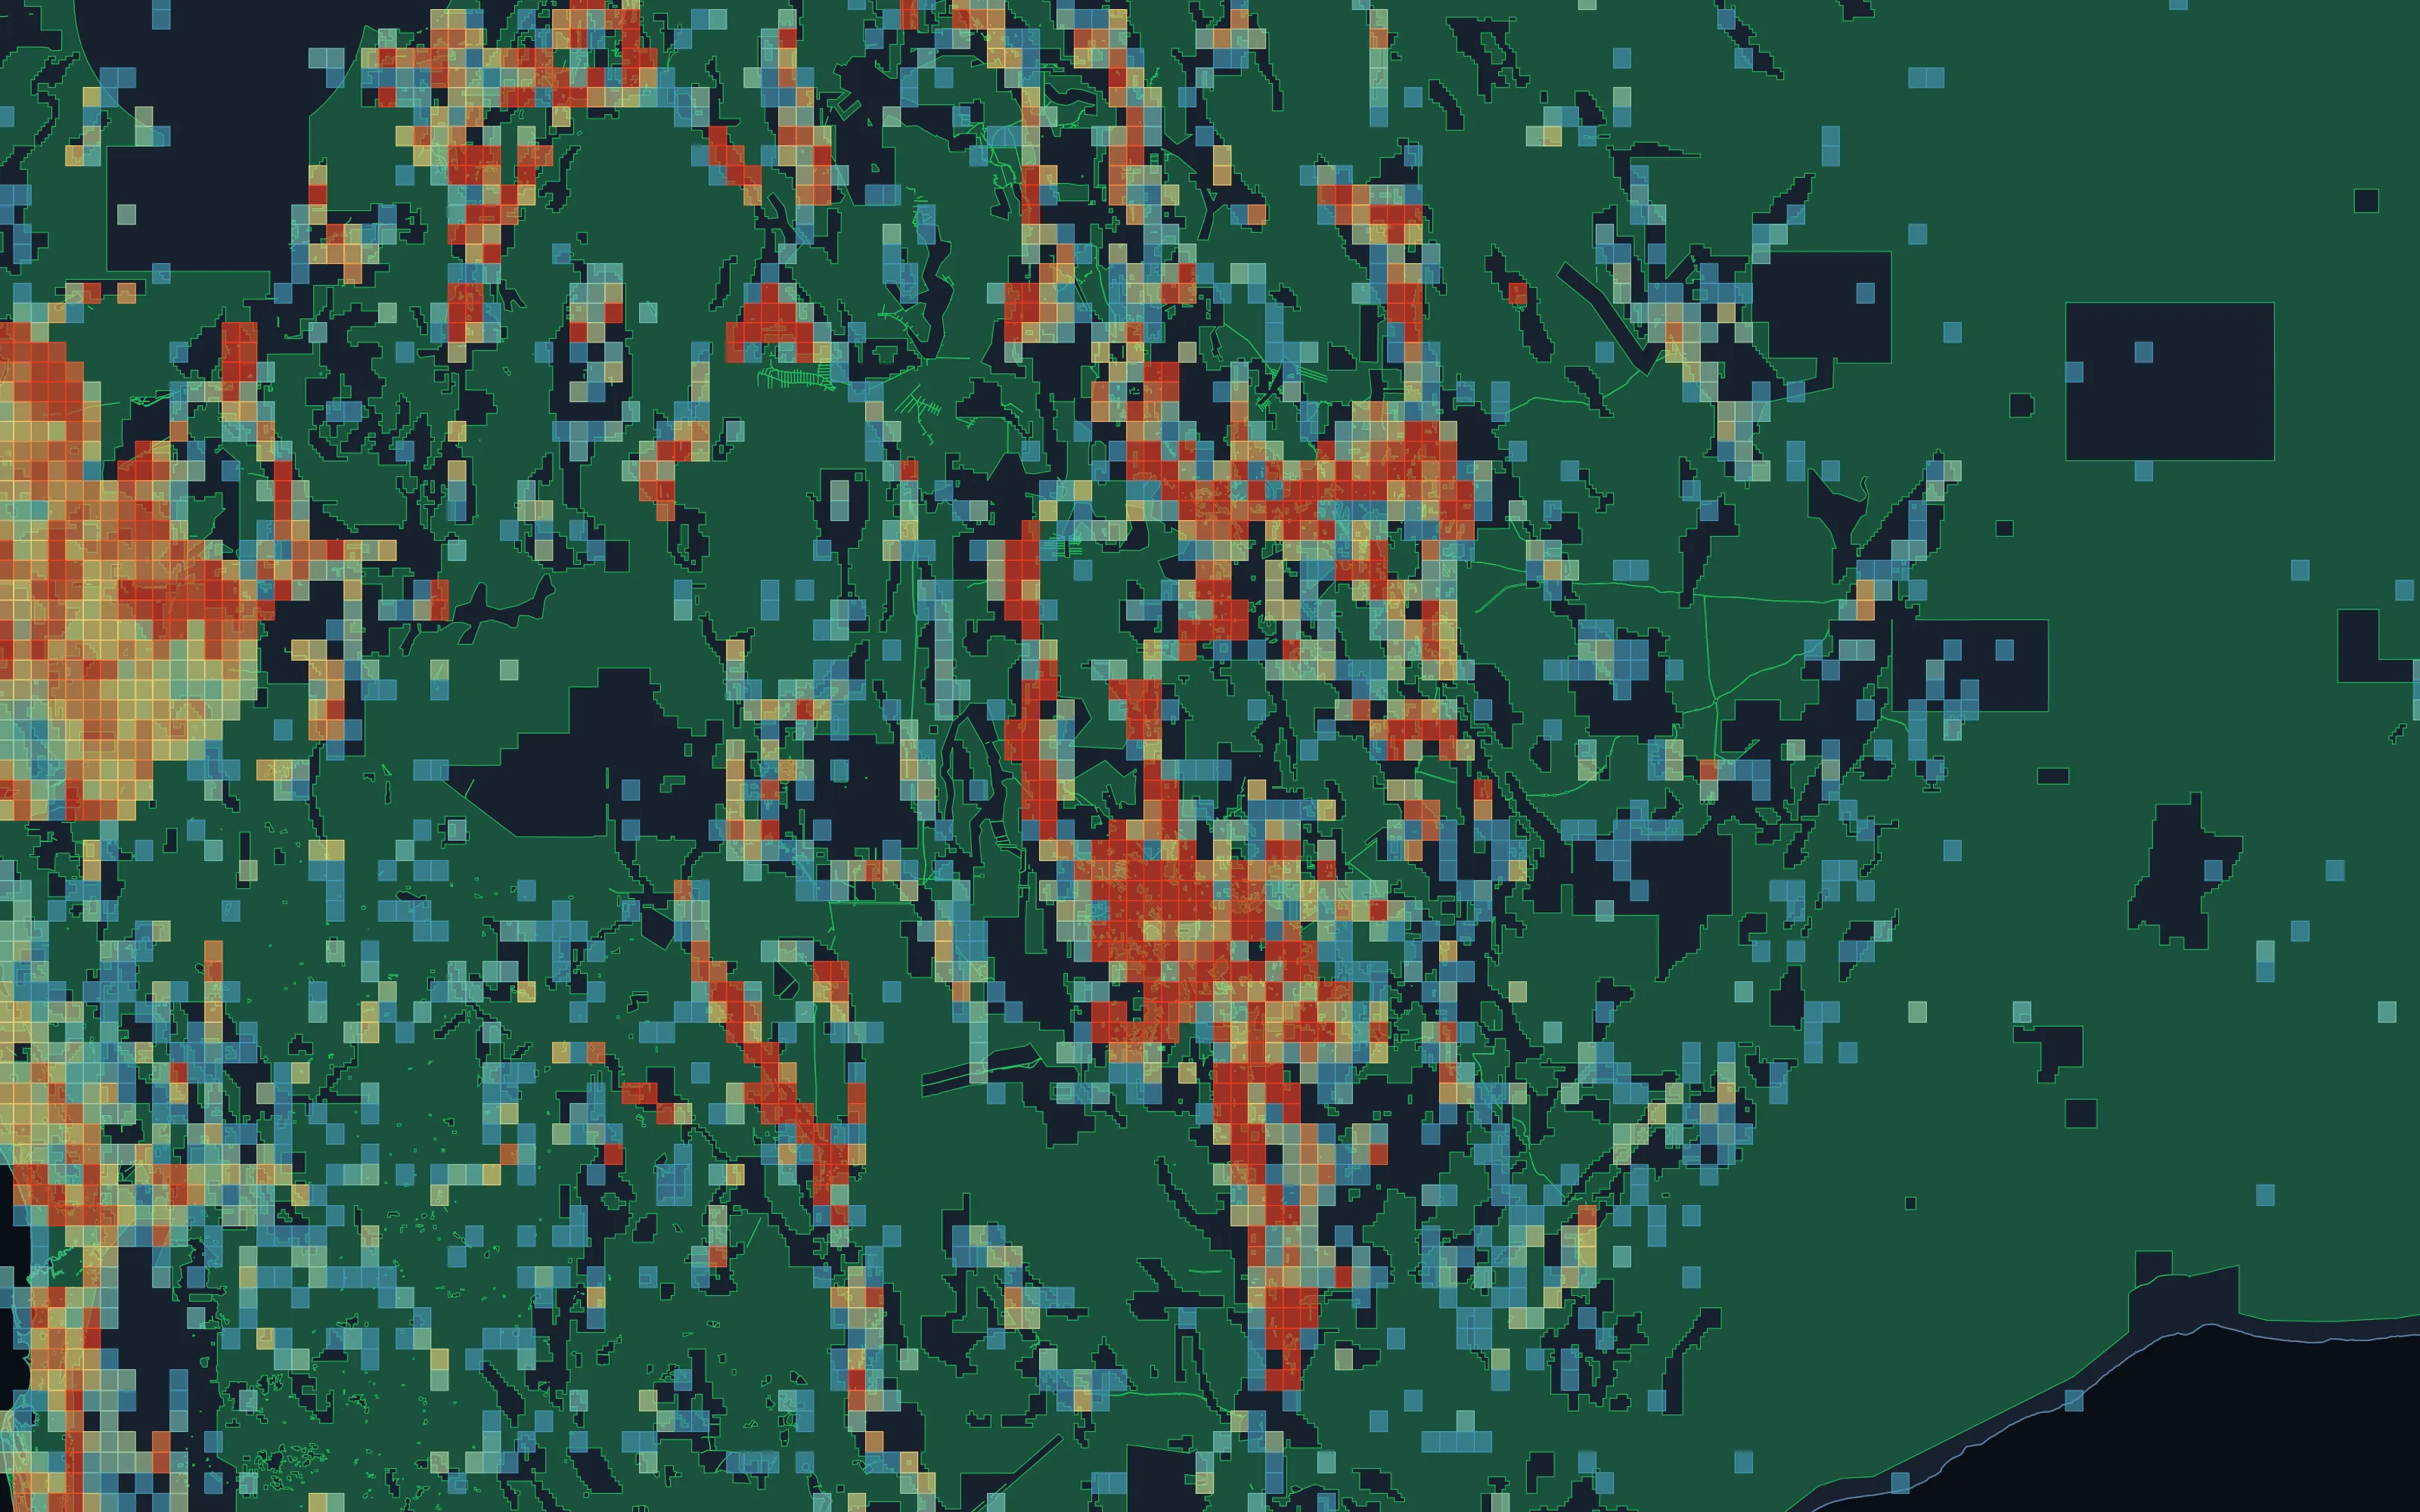
Eastern Goldfields, Western Australia. Open ground, with open pegging blocks ranked by recorded endowment. Rendered from our own data.



























Data published by 80 organisations ·Names and logos belong to their owners; no endorsement or partnership is implied. All 80 sources
The record
The groundwork, measured.
Counted from our holdings, not estimated. Deepest in Australia, the United States and Canada.
How we hold it- 18.2M
- Geoscience features
- Mapped geology, structure and deposits across 40 countries
- 8.7M
- Tenure records
- Live and historic titles from the registers of 48 countries
- 110M
- Distinct samples
- Published geochemistry from 162 sources, 94.8% of records Australian
- 1.01B
- Laboratory determinations
- Element, oxide and volatile values reported on those samples
Mineral intelligence
We rank open ground from the evidence, and show why.
Five capabilities, one engine, from a country to a ranked target. We use it first to find our own ground.
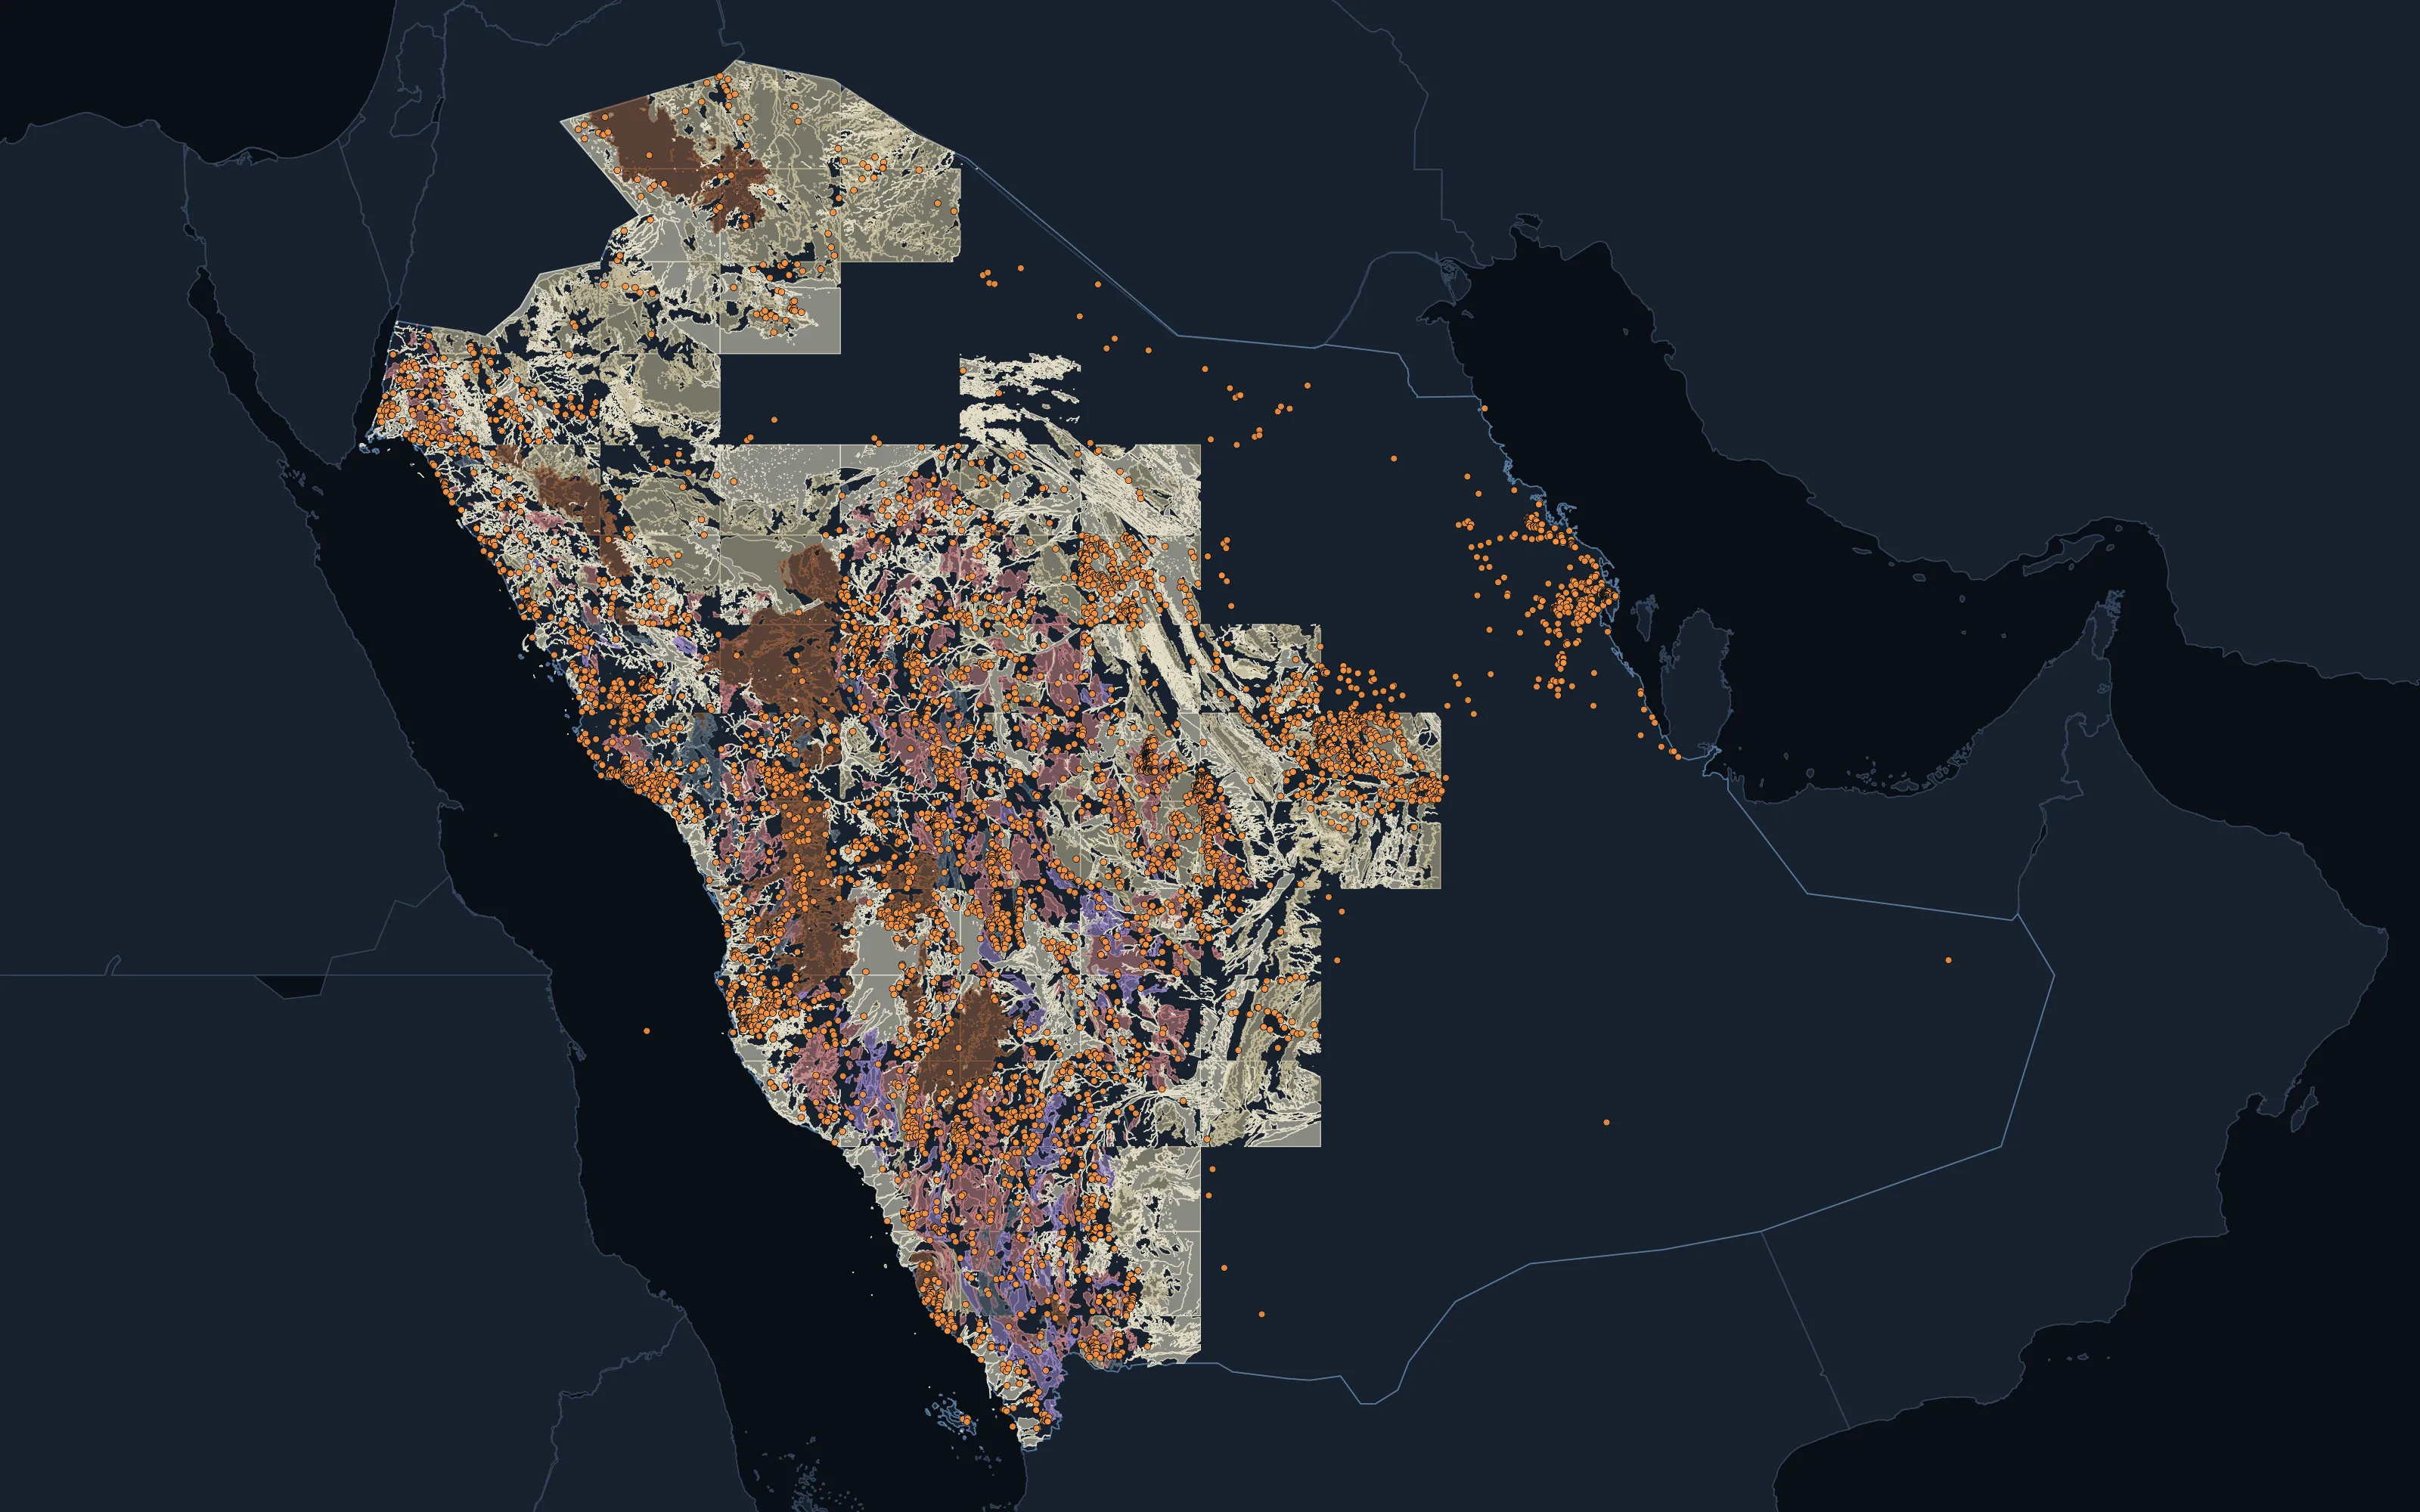
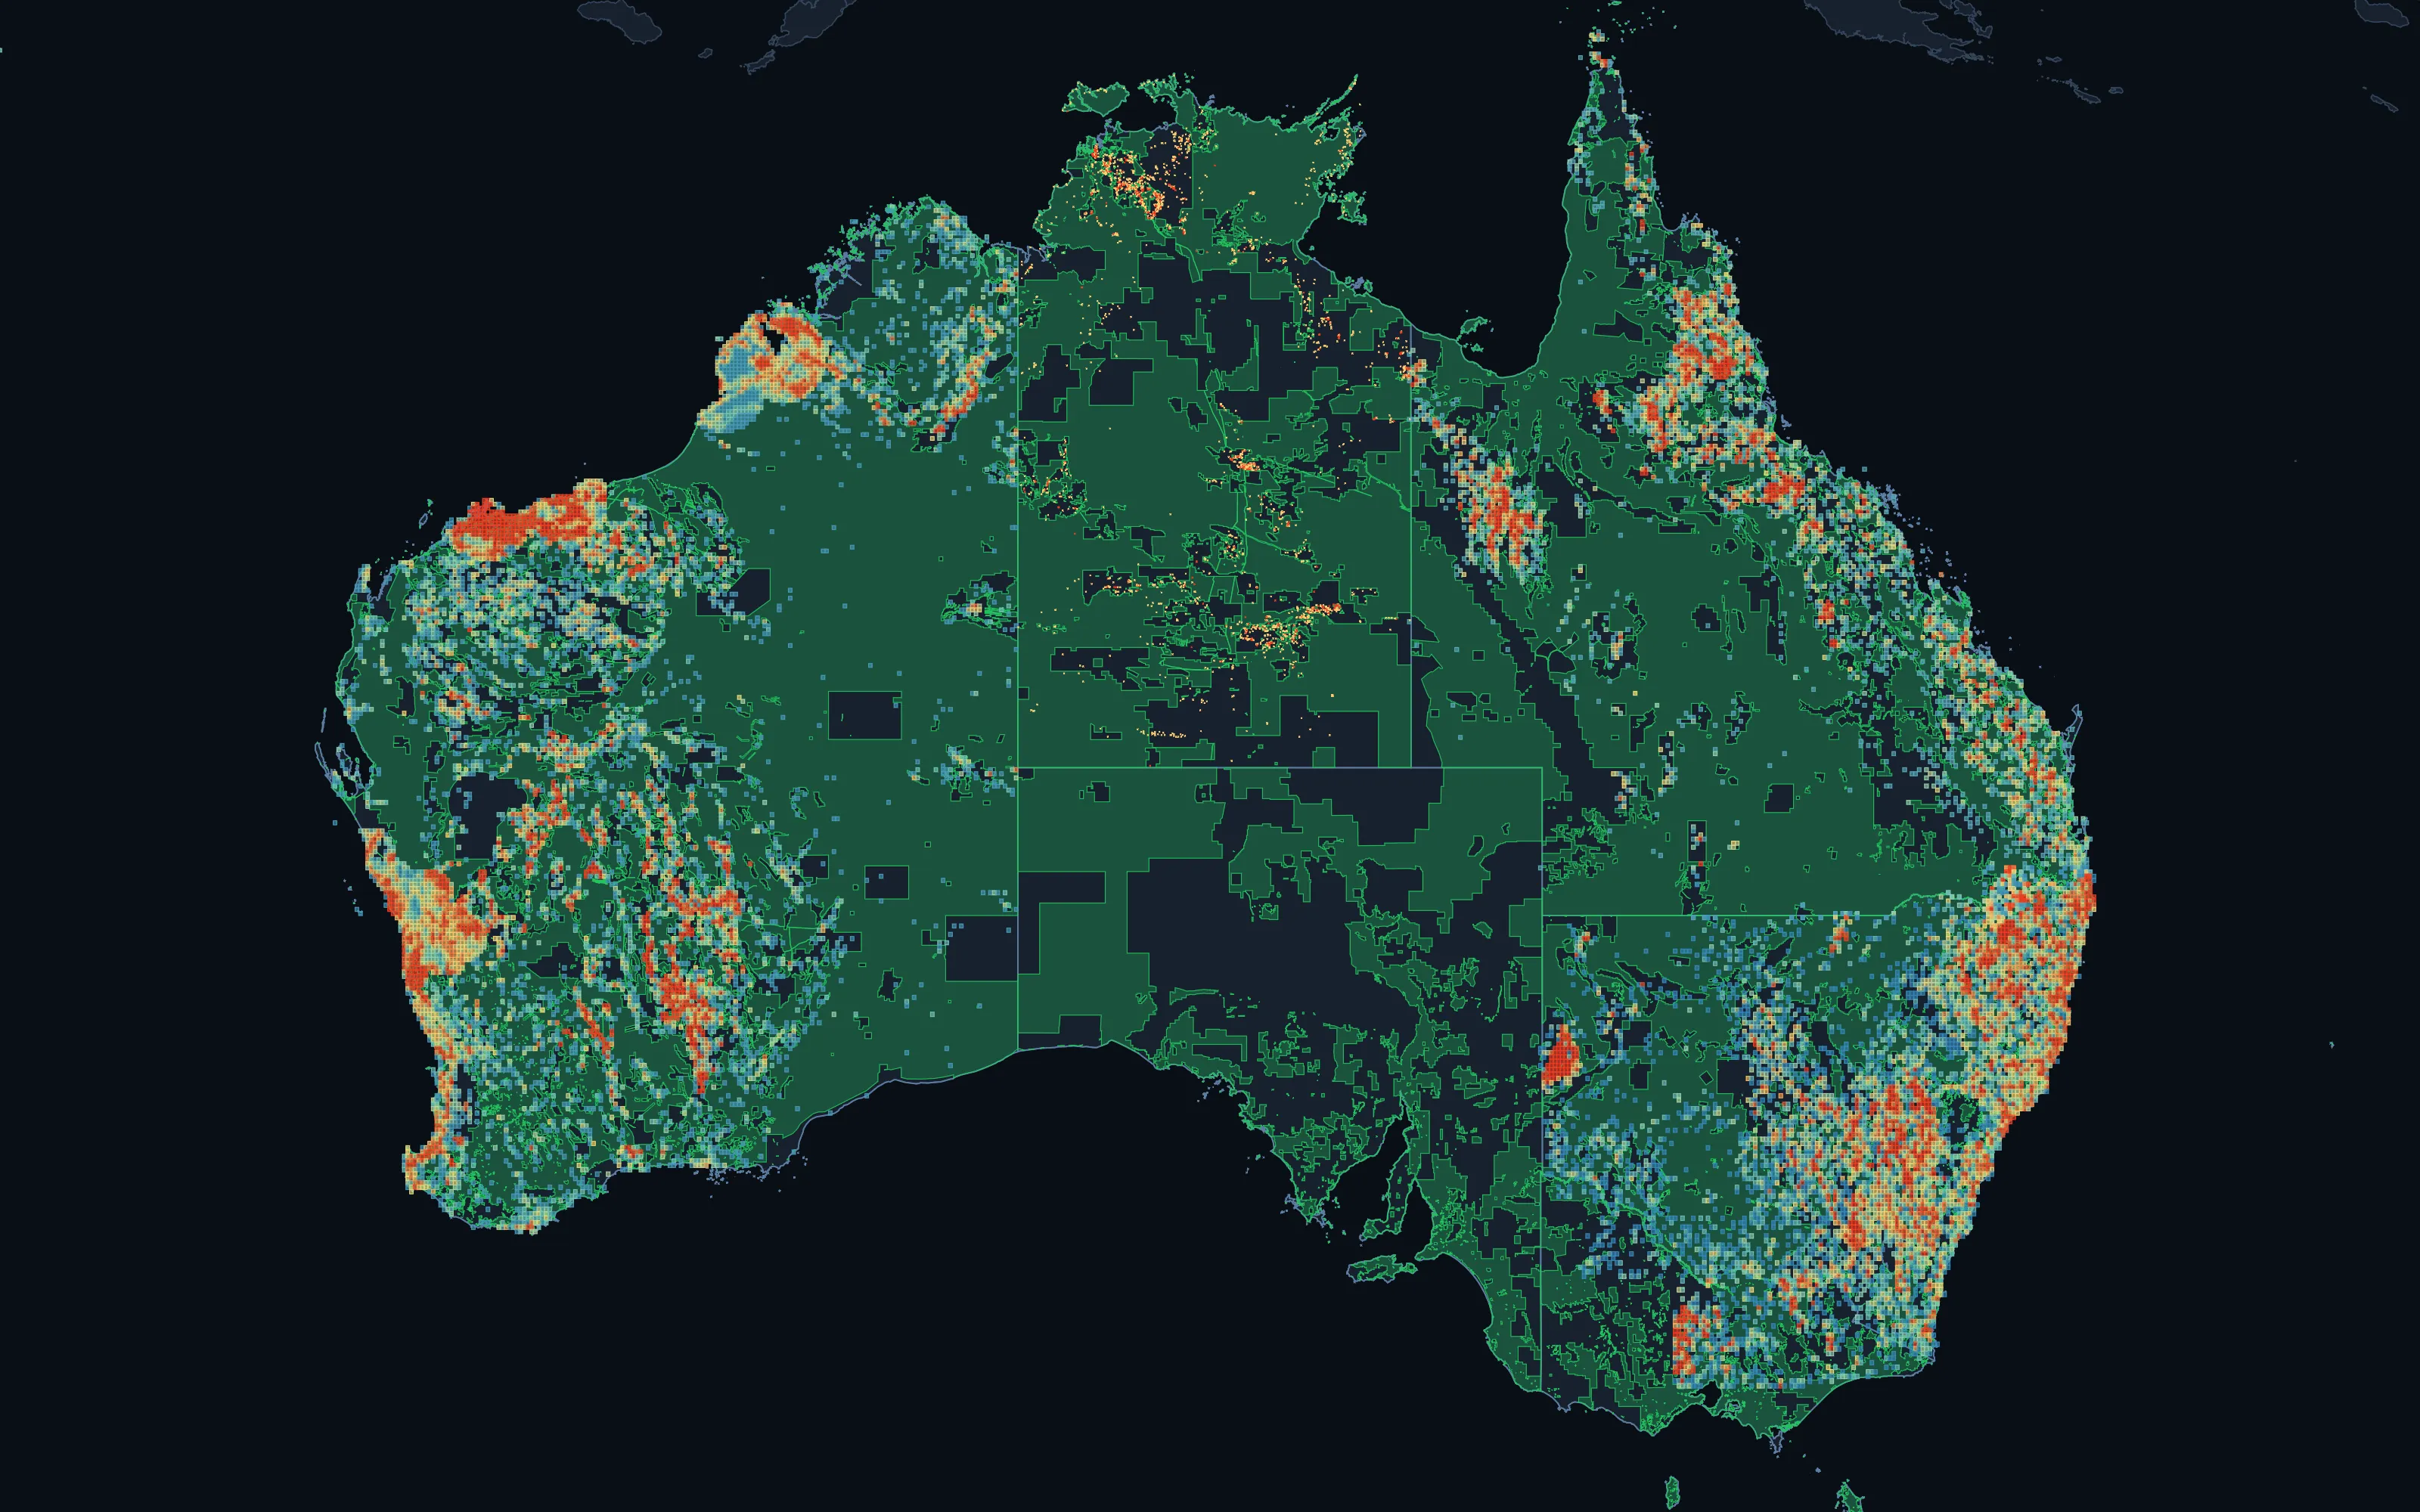
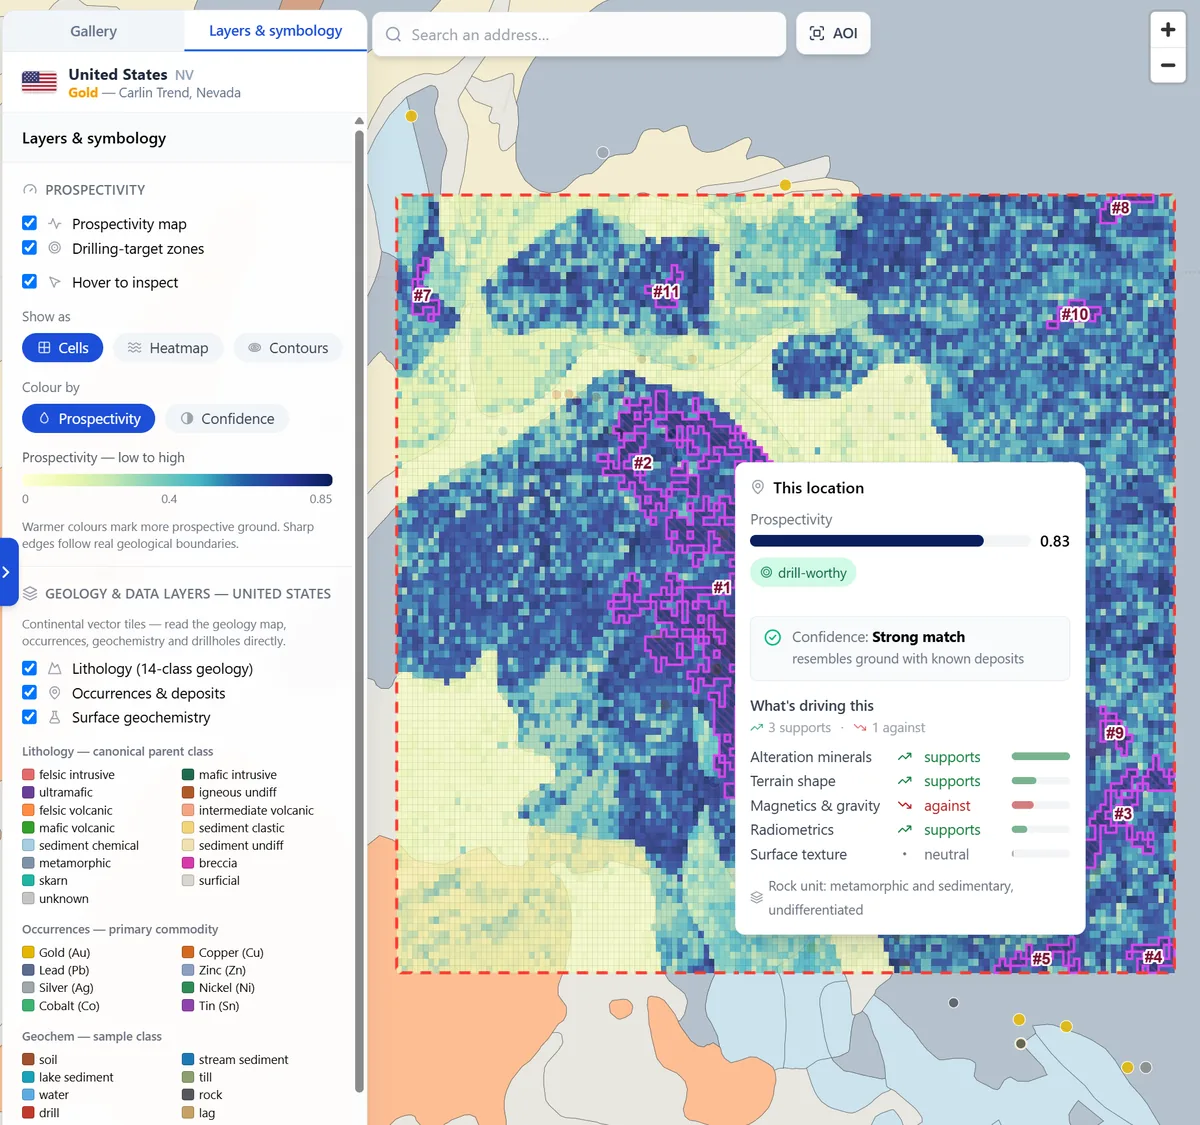
Partner
Spectral remote sensing, with GeoSpectra.
Australian specialists in spectral remote sensing and geospatial intelligence for mineral exploration. Our spectral and structural mapping is delivered with them, from free imagery to camp-scale WorldView-3.
geospectra.com.au ↗Machine learning, in service now
Models that rank the ground.
Machine-learning prospectivity for 51 minerals, trained on 13.8M samples. Every target comes with the evidence behind it.
- 130+
- National models
- 51 minerals across Australia, the United States and Canada
- 13.8M
- Training samples
- Soil, stream-sediment and rock-chip samples with laboratory assays
- 44
- Minerals in the global model
- Beyond Australia, the United States and Canada, on exposed ground
- 10 km
- Test separation
- National models are scored only on ground at least this far from their training data
National models
For each mineral in Australia, the United States and Canada. A run scores the ground and returns ranked targets, each with its evidence and a flag where that evidence is thin.
A global model
44 minerals everywhere else, read from satellite alteration, radar texture and terrain on exposed ground. It returns a prospectivity map and a confidence read for every cell.
Next, a foundation model
One model over the full record, in map view and in 3D, tested on ground held back from training and then against history before we use it.
Next, the models are retrained on the full record and new sources, such as hyperspectral imagery, before we use them to rank and select ground.
In development
Next, reading the drill core.
We hold the raw spectra from Australia's national drill-core library, matched to laboratory assays where they exist. Next, we will train a model to read mineralogy and grade from the spectrum.
Already in the record: which scanned holes sit near any piece of ground, what the scanner recorded down each, and, in four states and territories, whether assays exist for the same intervals.
- 489.3M
- Raw spectra
- Visible to thermal infrared, measured down the core
- 6,546
- Scanned holes
- In six states and territories
- 2,746
- Holes matched to assays
- Spectra lined up with laboratory chemistry, metre by metre
Scans: AuScope National Virtual Core Library, CSIRO and the state and territory geological surveys.
Reach
Where we hold data.
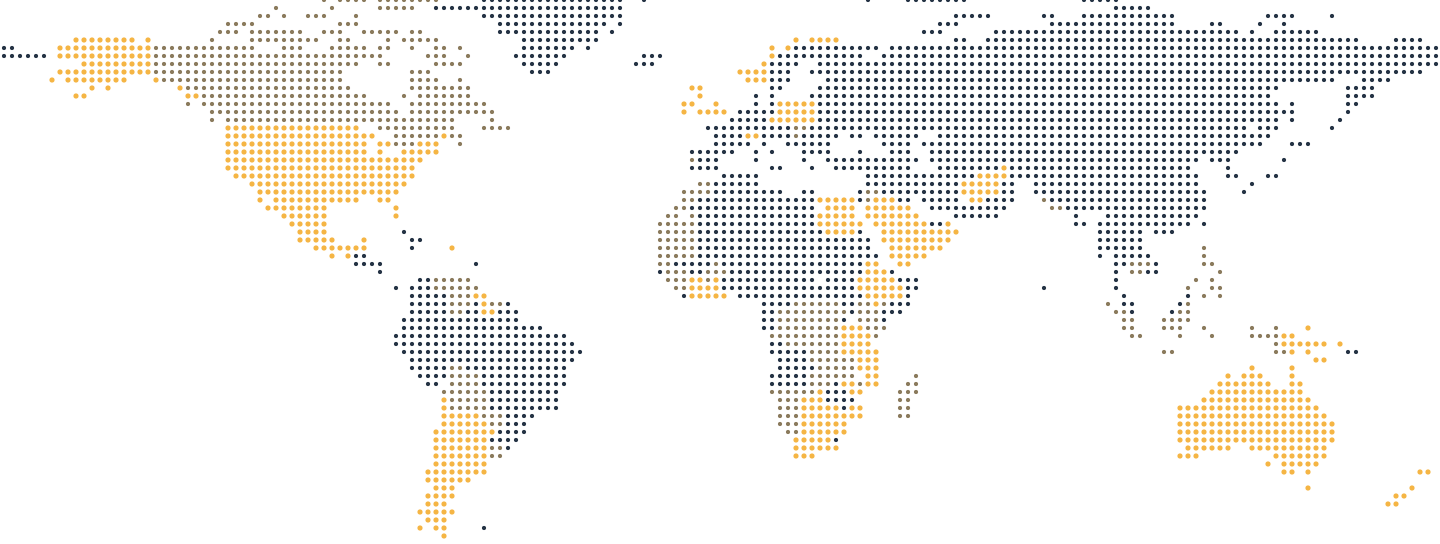
Data held for 56 countries, and a full country atlas built for 28 of them.
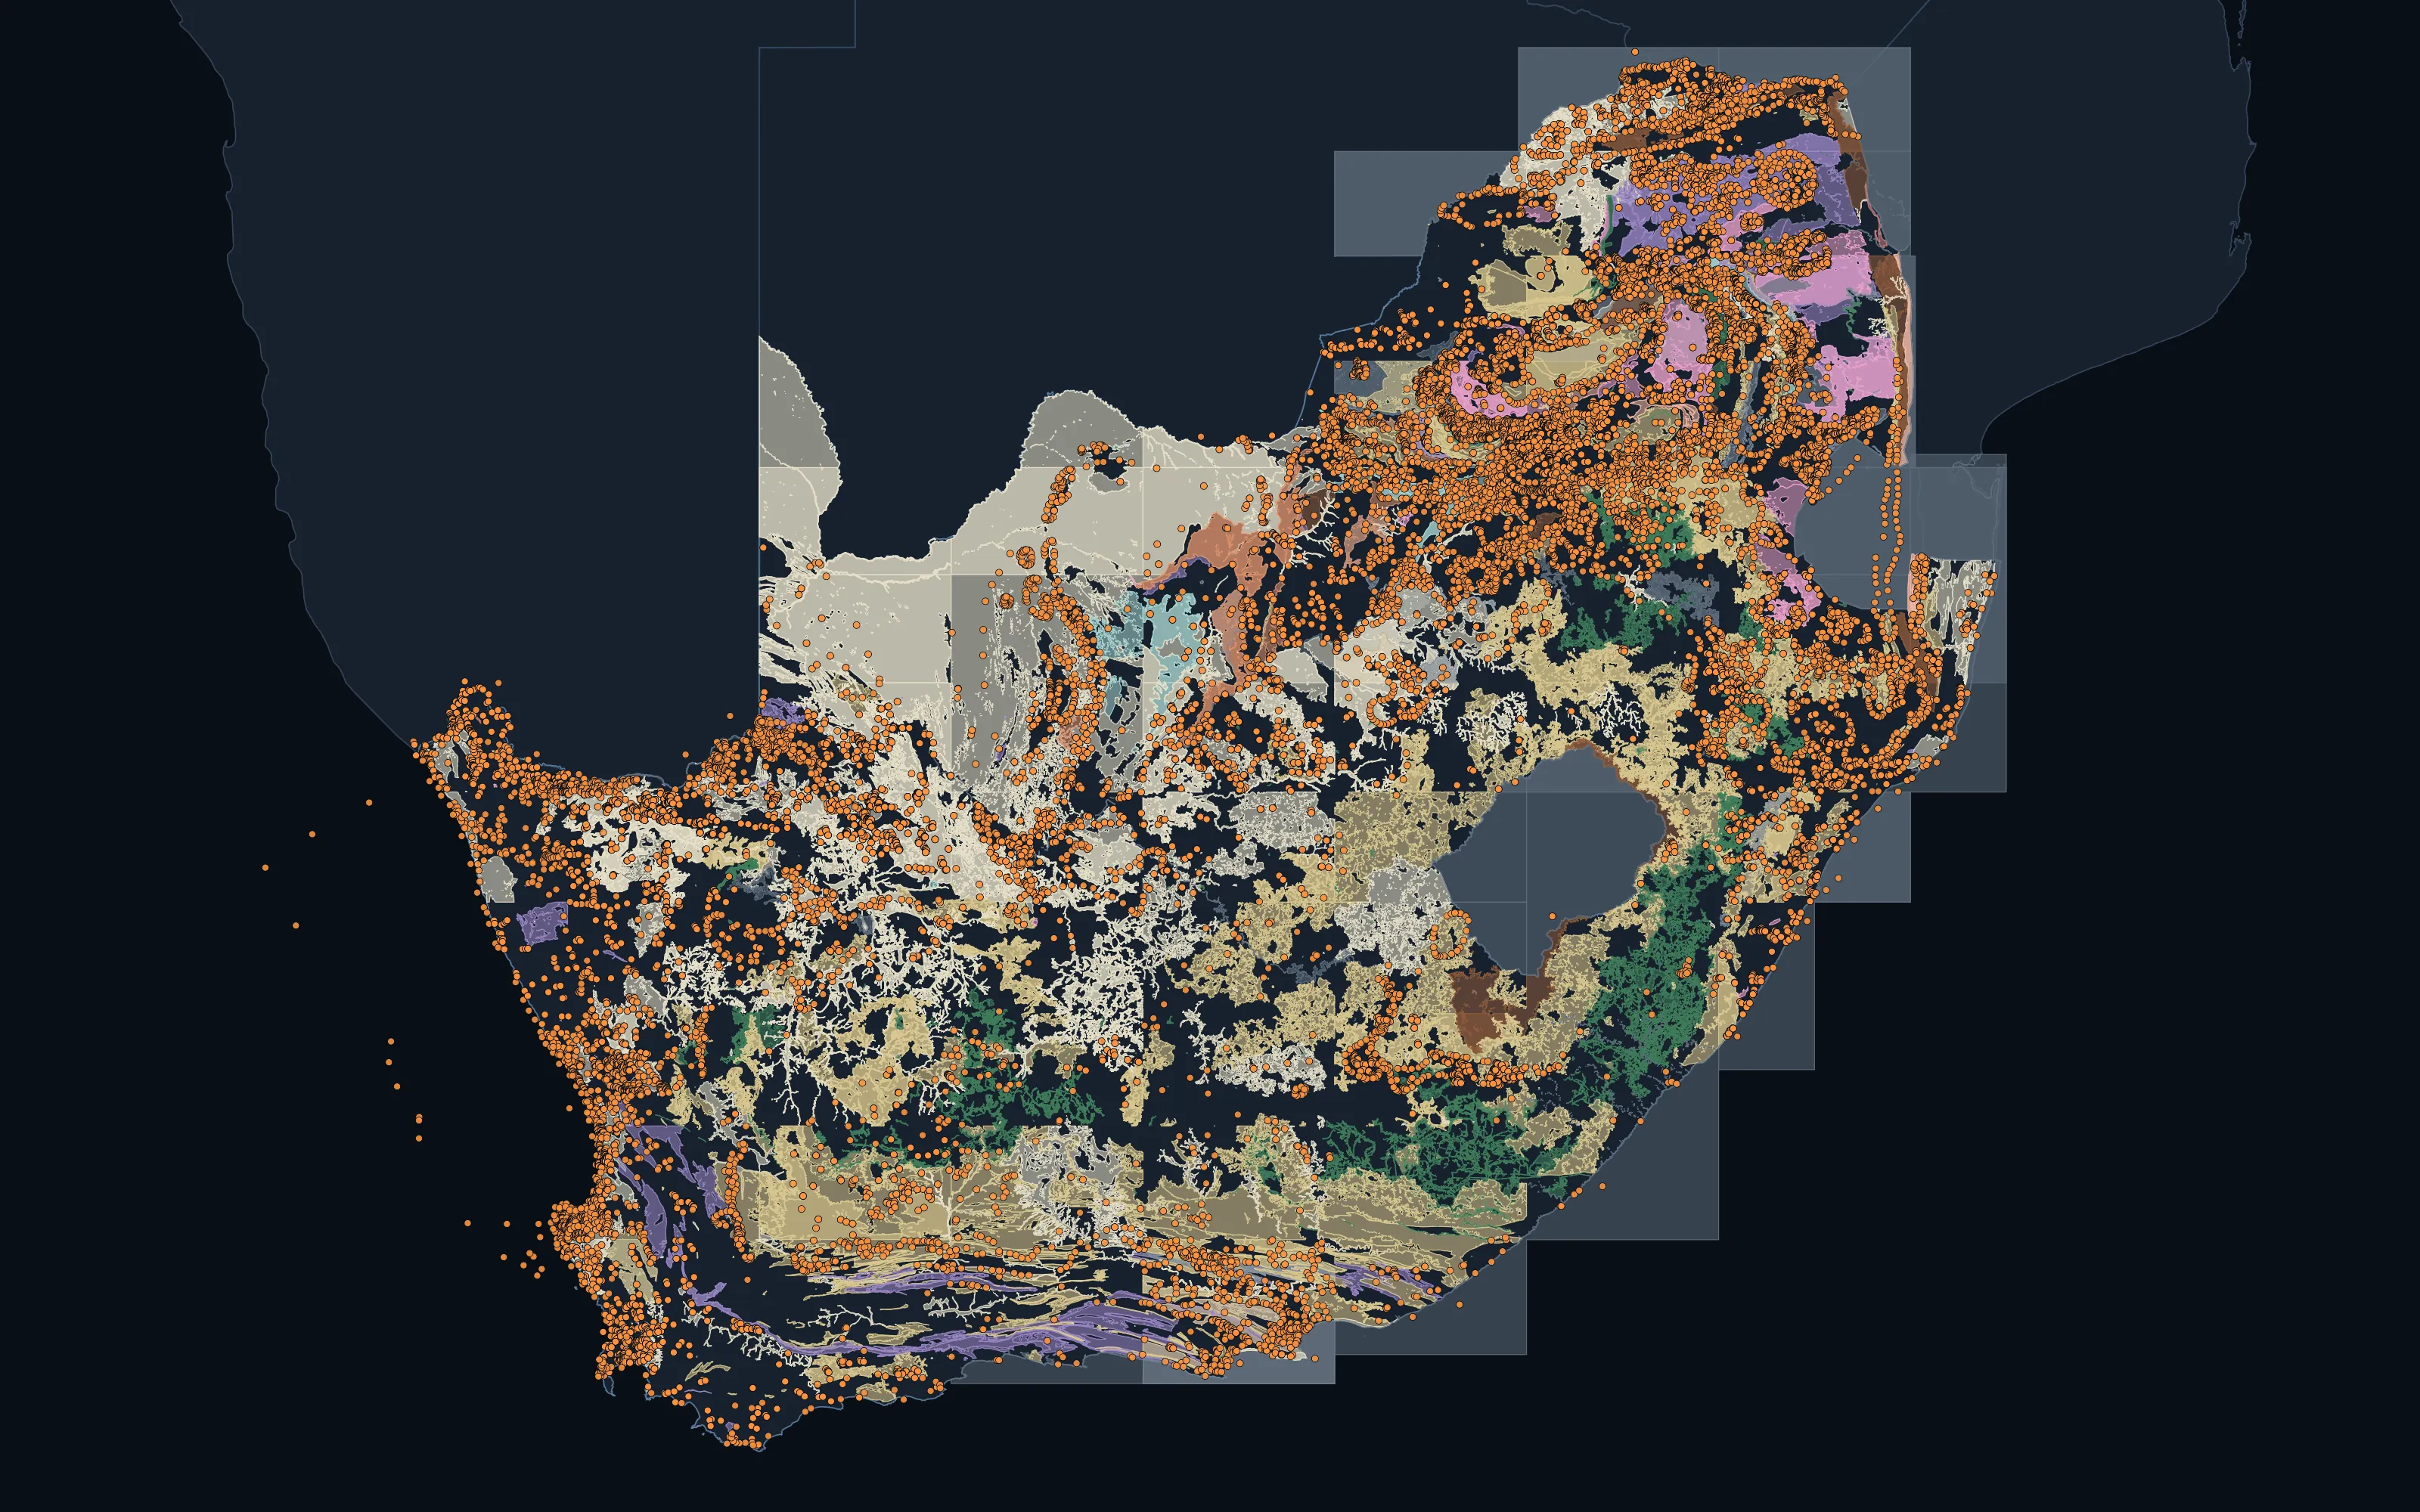
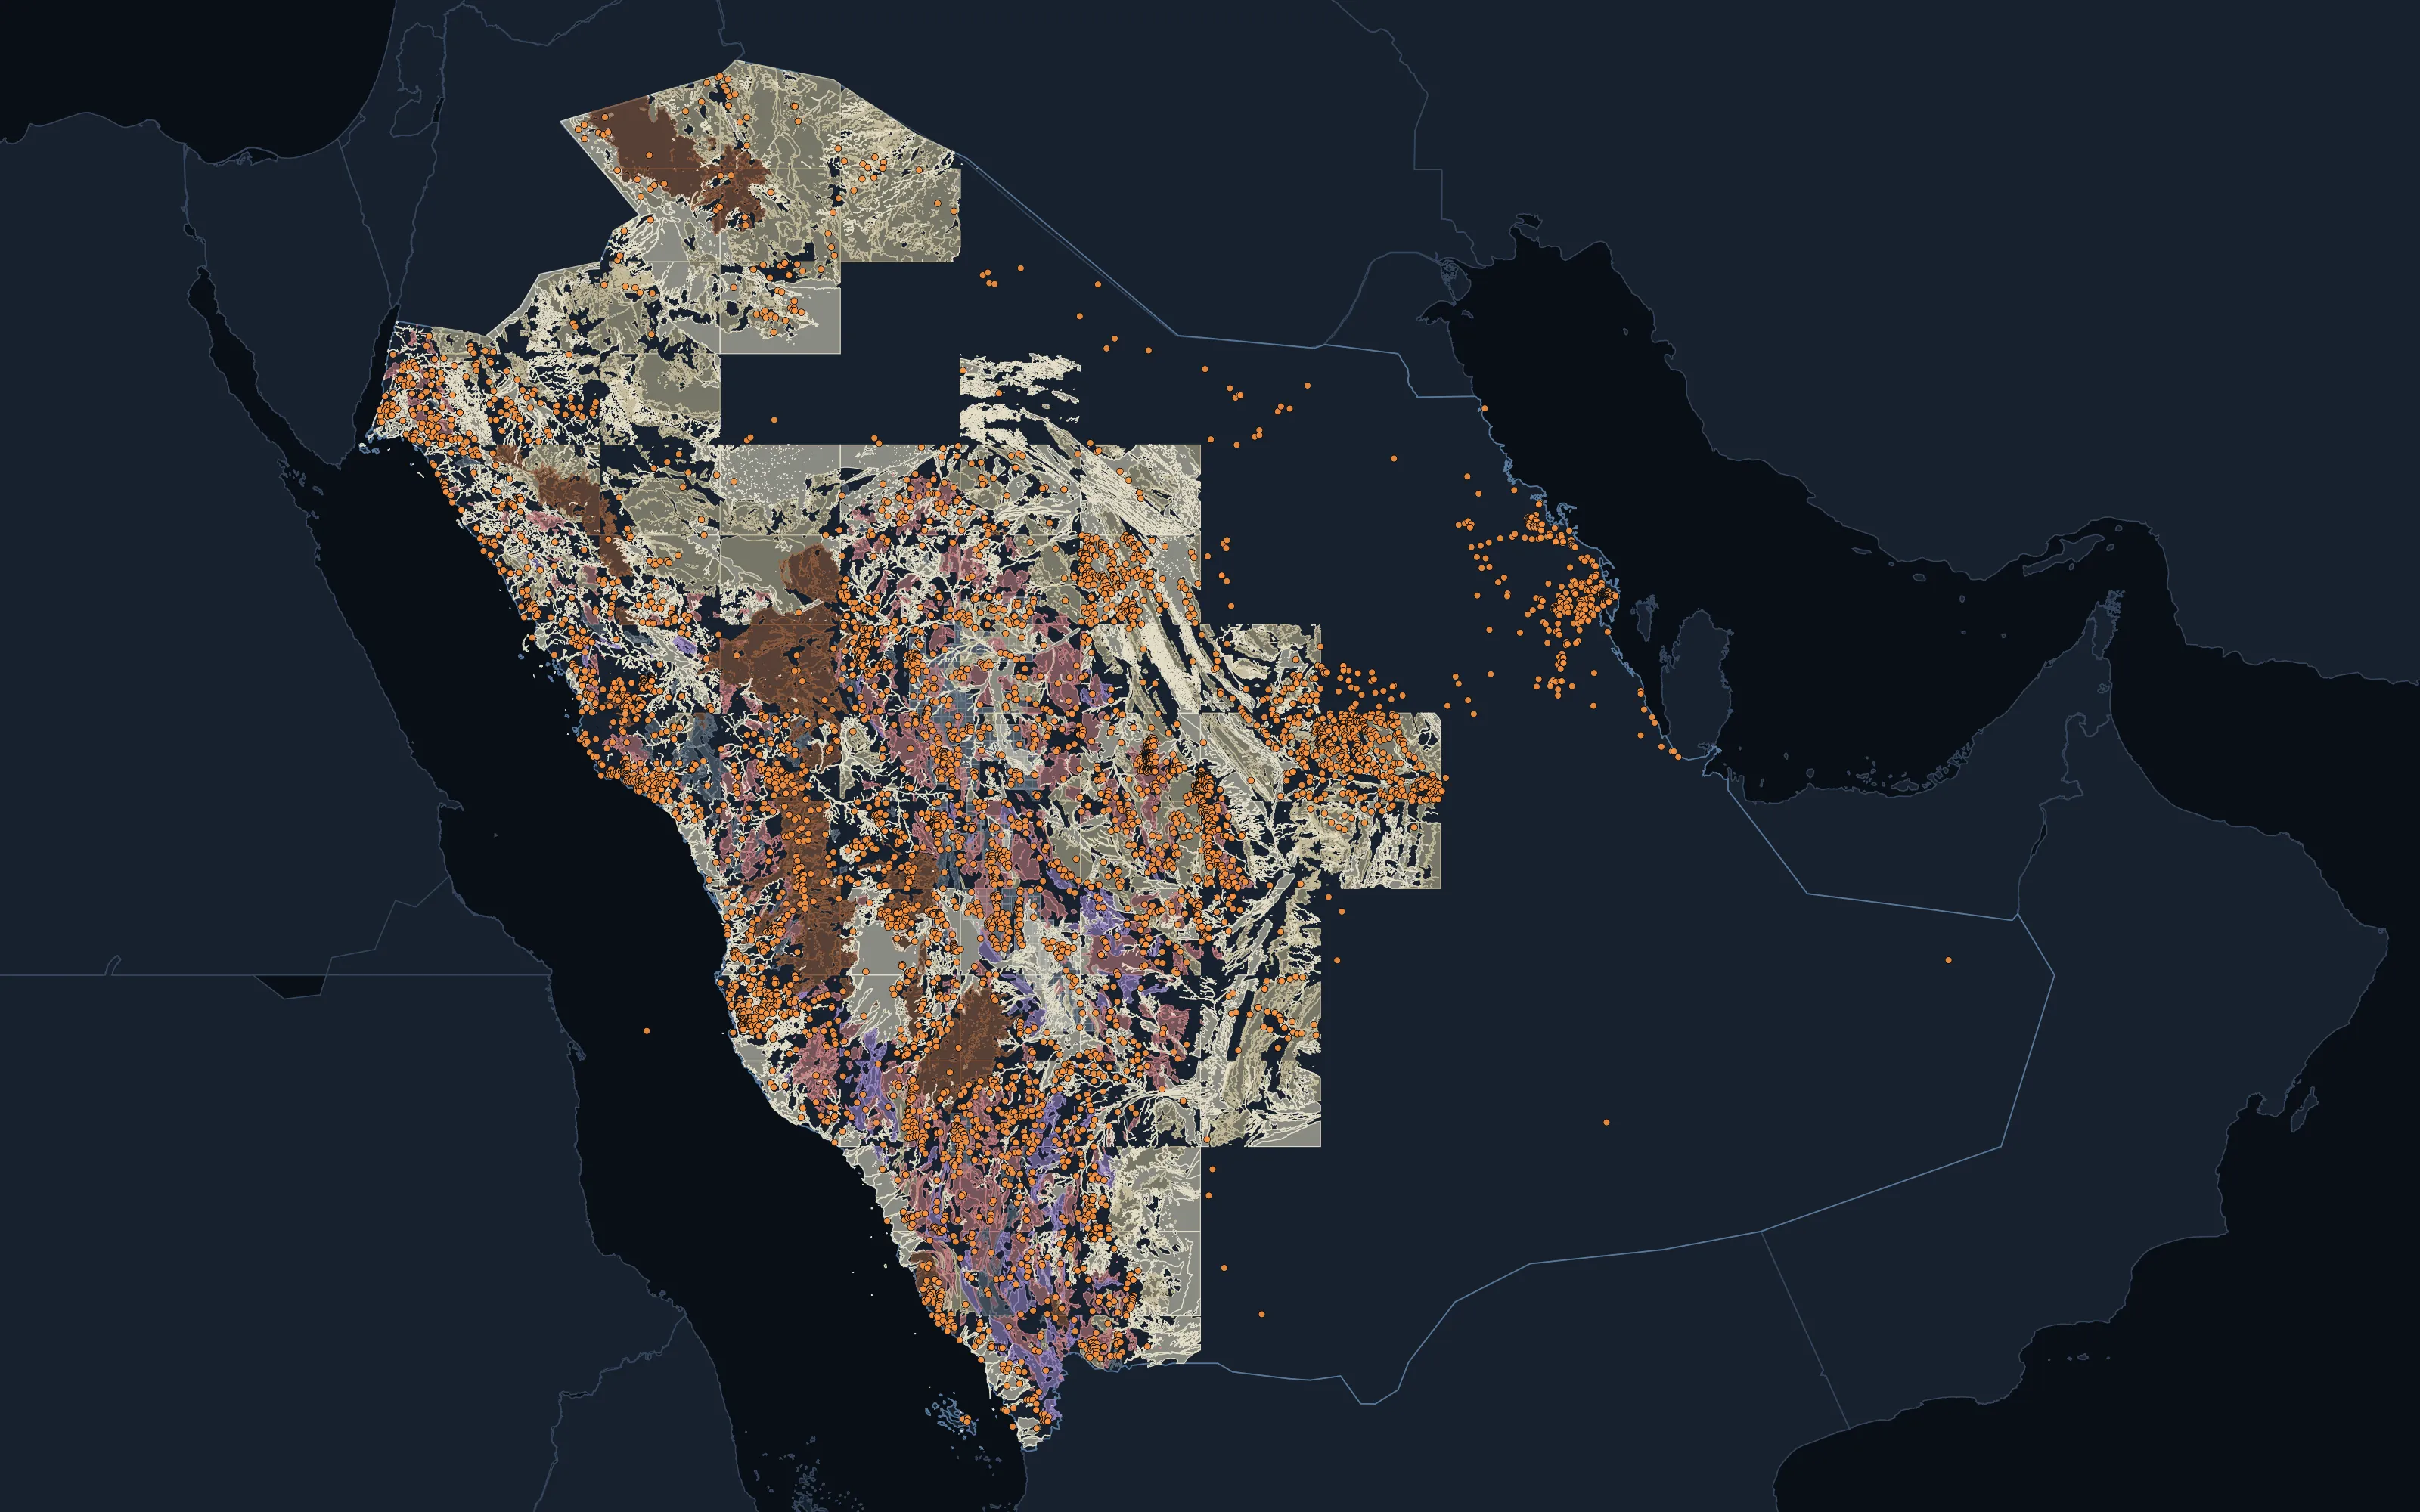
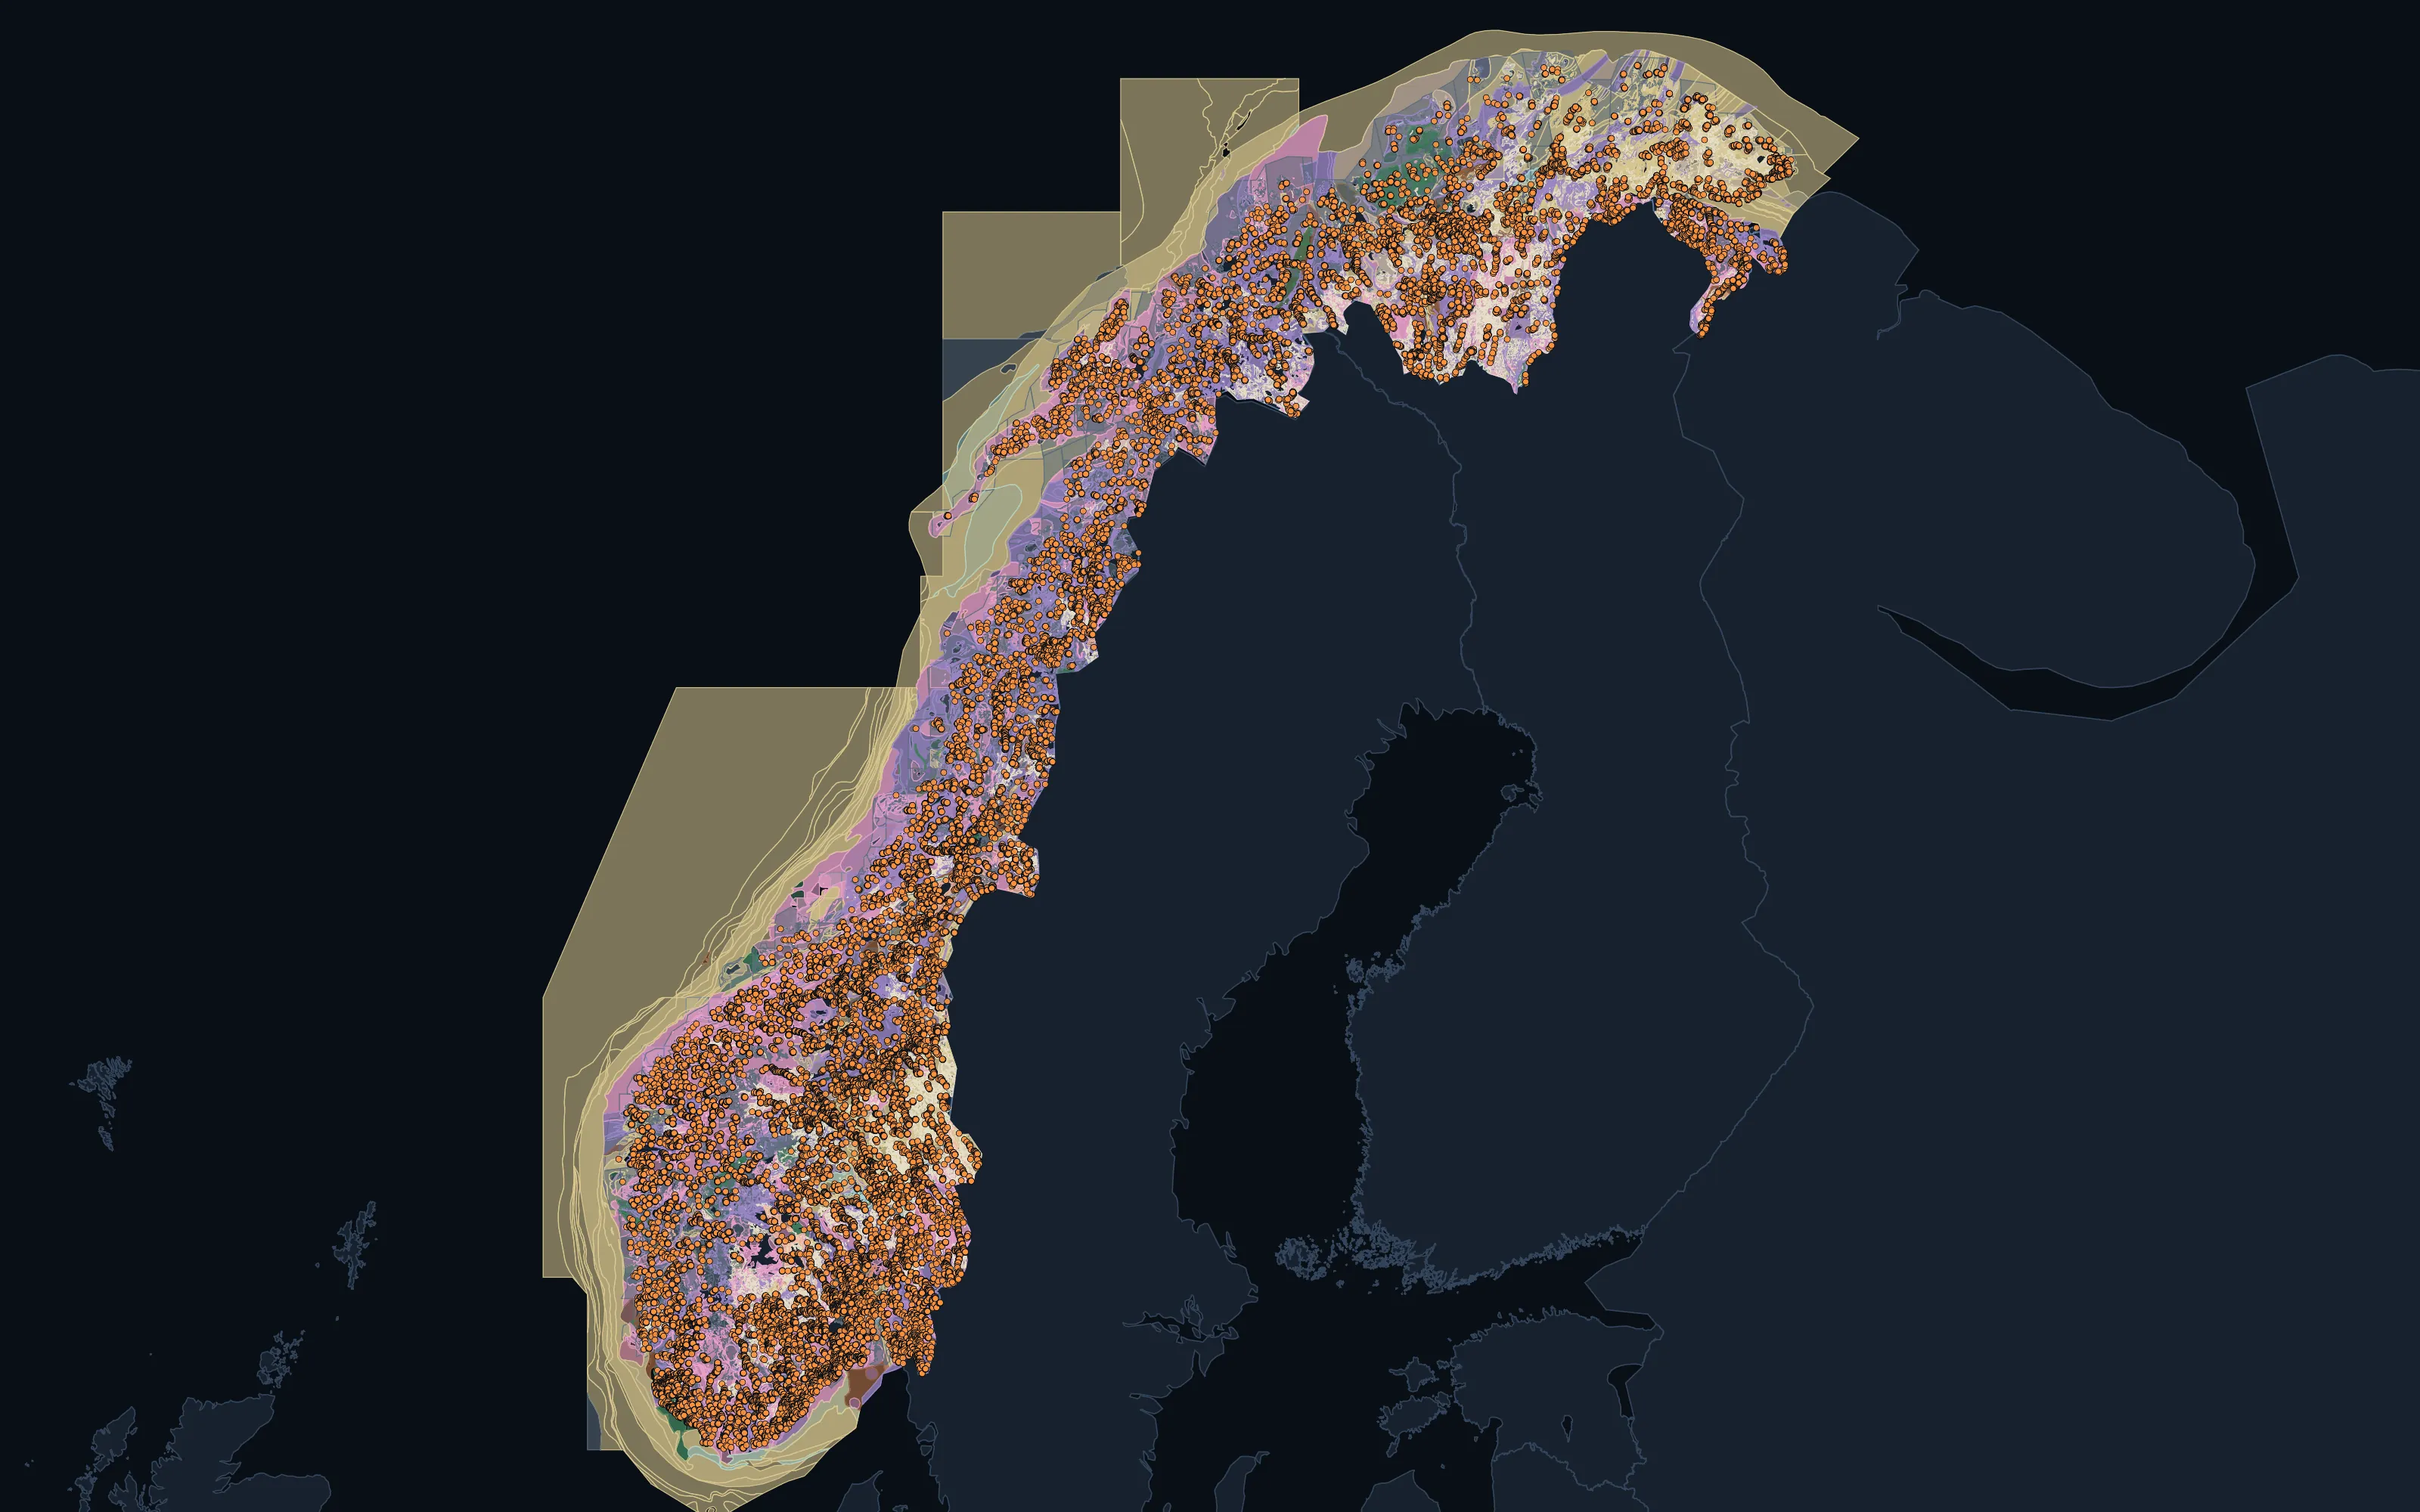
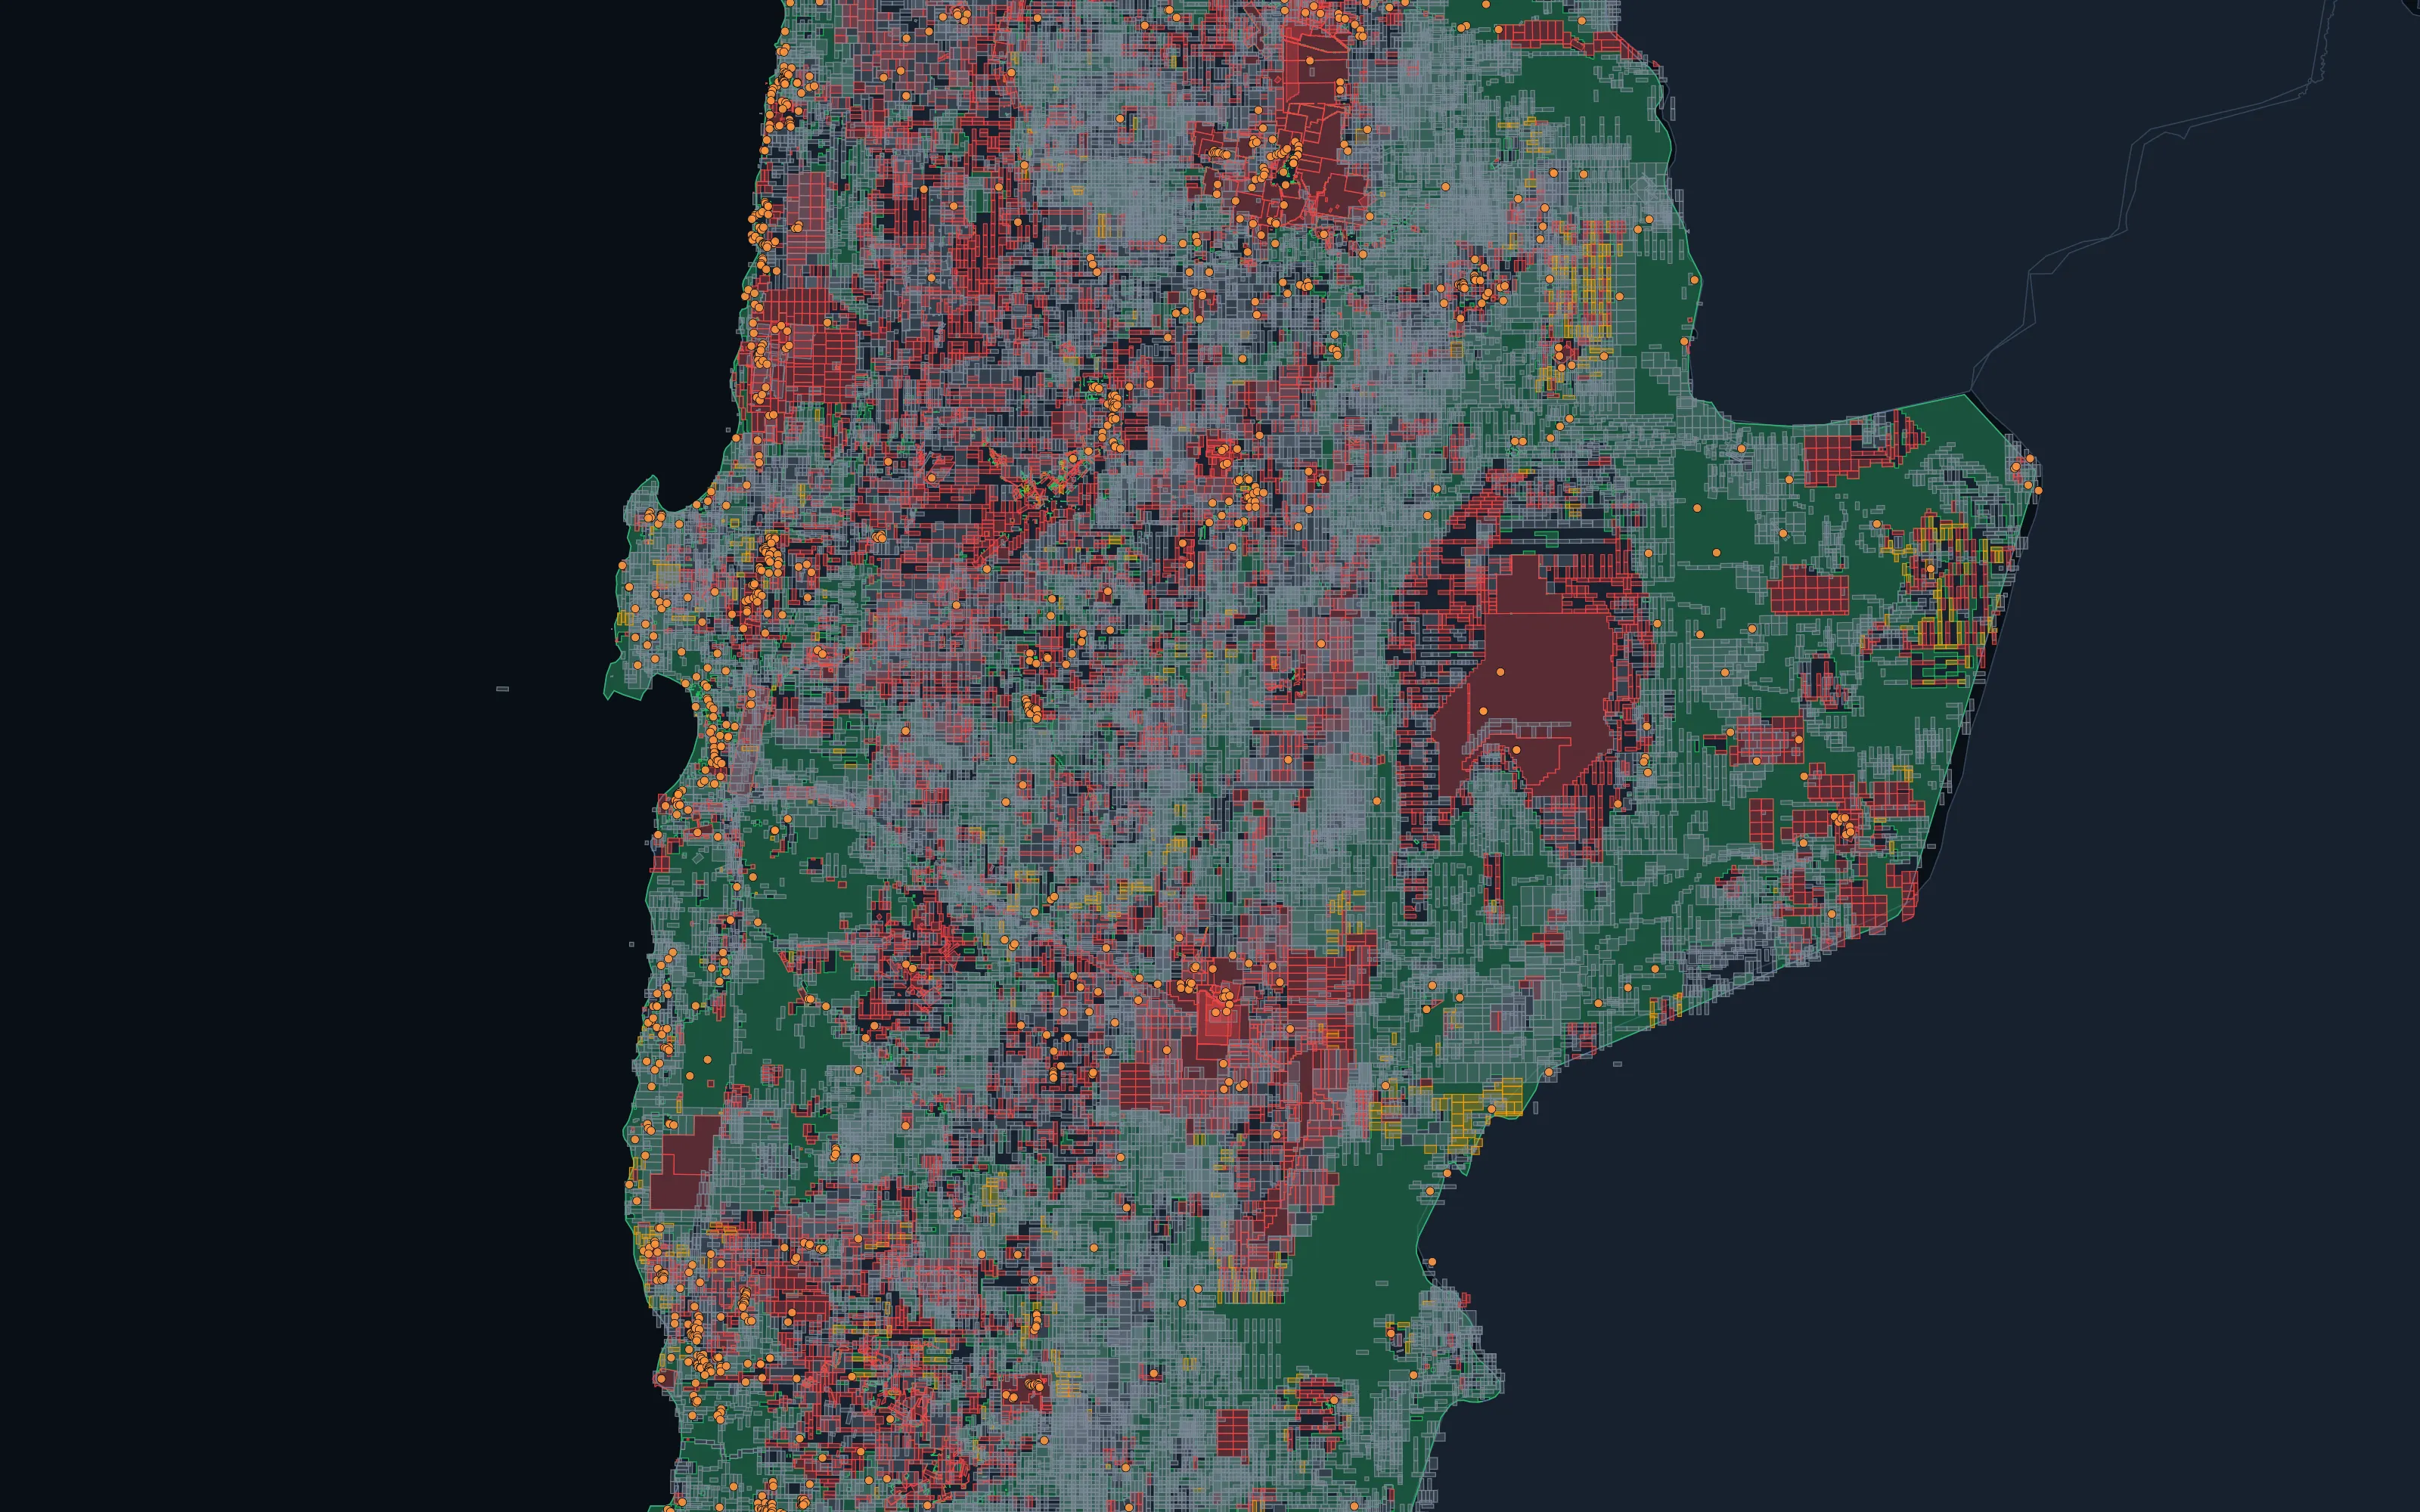
Open Ground
Find ground you can actually peg.
In many jurisdictions a petroleum title does not stop a mineral one. We read the two separately, so open ground is not written off by mistake.
Alberta
42.3%
open for a mineral title
23.6% if every title counts as held
Northern Territory
80.2%
open for a mineral title
62.8% if every title counts as held
Questions
Straight answers.
What does MineDSS do?
MineDSS ranks open ground from the published record and shows why. The engine combines country geoscience, open-ground analysis, machine-learning prospectivity for 51 minerals, spectral mapping and tenure due diligence.
What is mineral prospectivity mapping?
A map of where the ground is most likely to carry anomalous values of a target metal, built from geology, geophysics, terrain and satellite evidence. Our machine-learning models score the ground and show the evidence behind each target. In Australia, the United States and Canada a run also returns ranked targets.
Which minerals and countries do you cover?
51 minerals: national models in Australia (47), the United States (51) and Canada (37), and a global model for 44 minerals everywhere else. We hold published geoscience for 56 countries, with a full country atlas for 28.
How do you find open ground?
We read each licensing authority's own register, keep mineral and petroleum titles separate, remove excluded land wherever we hold an exclusion layer, and rank the open blocks on the recorded deposit record. 55 jurisdictions are covered.
How are your models tested?
Every model is scored on ground held back from its training; for the national models that test ground sits at least 10 km from anything they trained on. A model that fails is not used, for any mineral, in any country. Next, the models are retrained on the full record and new sources, such as hyperspectral imagery, before we use them to rank and select ground.
-
Partners
Exploration and mining companies interested in working with us.
-
Investors
The record, the models and the ground they point to.
-
Publishers and researchers
Geological surveys, universities and programmes whose work the record is built on.