Spectral Remote Sensing
What is at surface, and what structures control it?
Alteration minerals, structures and rock boundaries mapped from satellite, from regional scale to camp scale, matched against laboratory spectra and tied to the structures that control them.
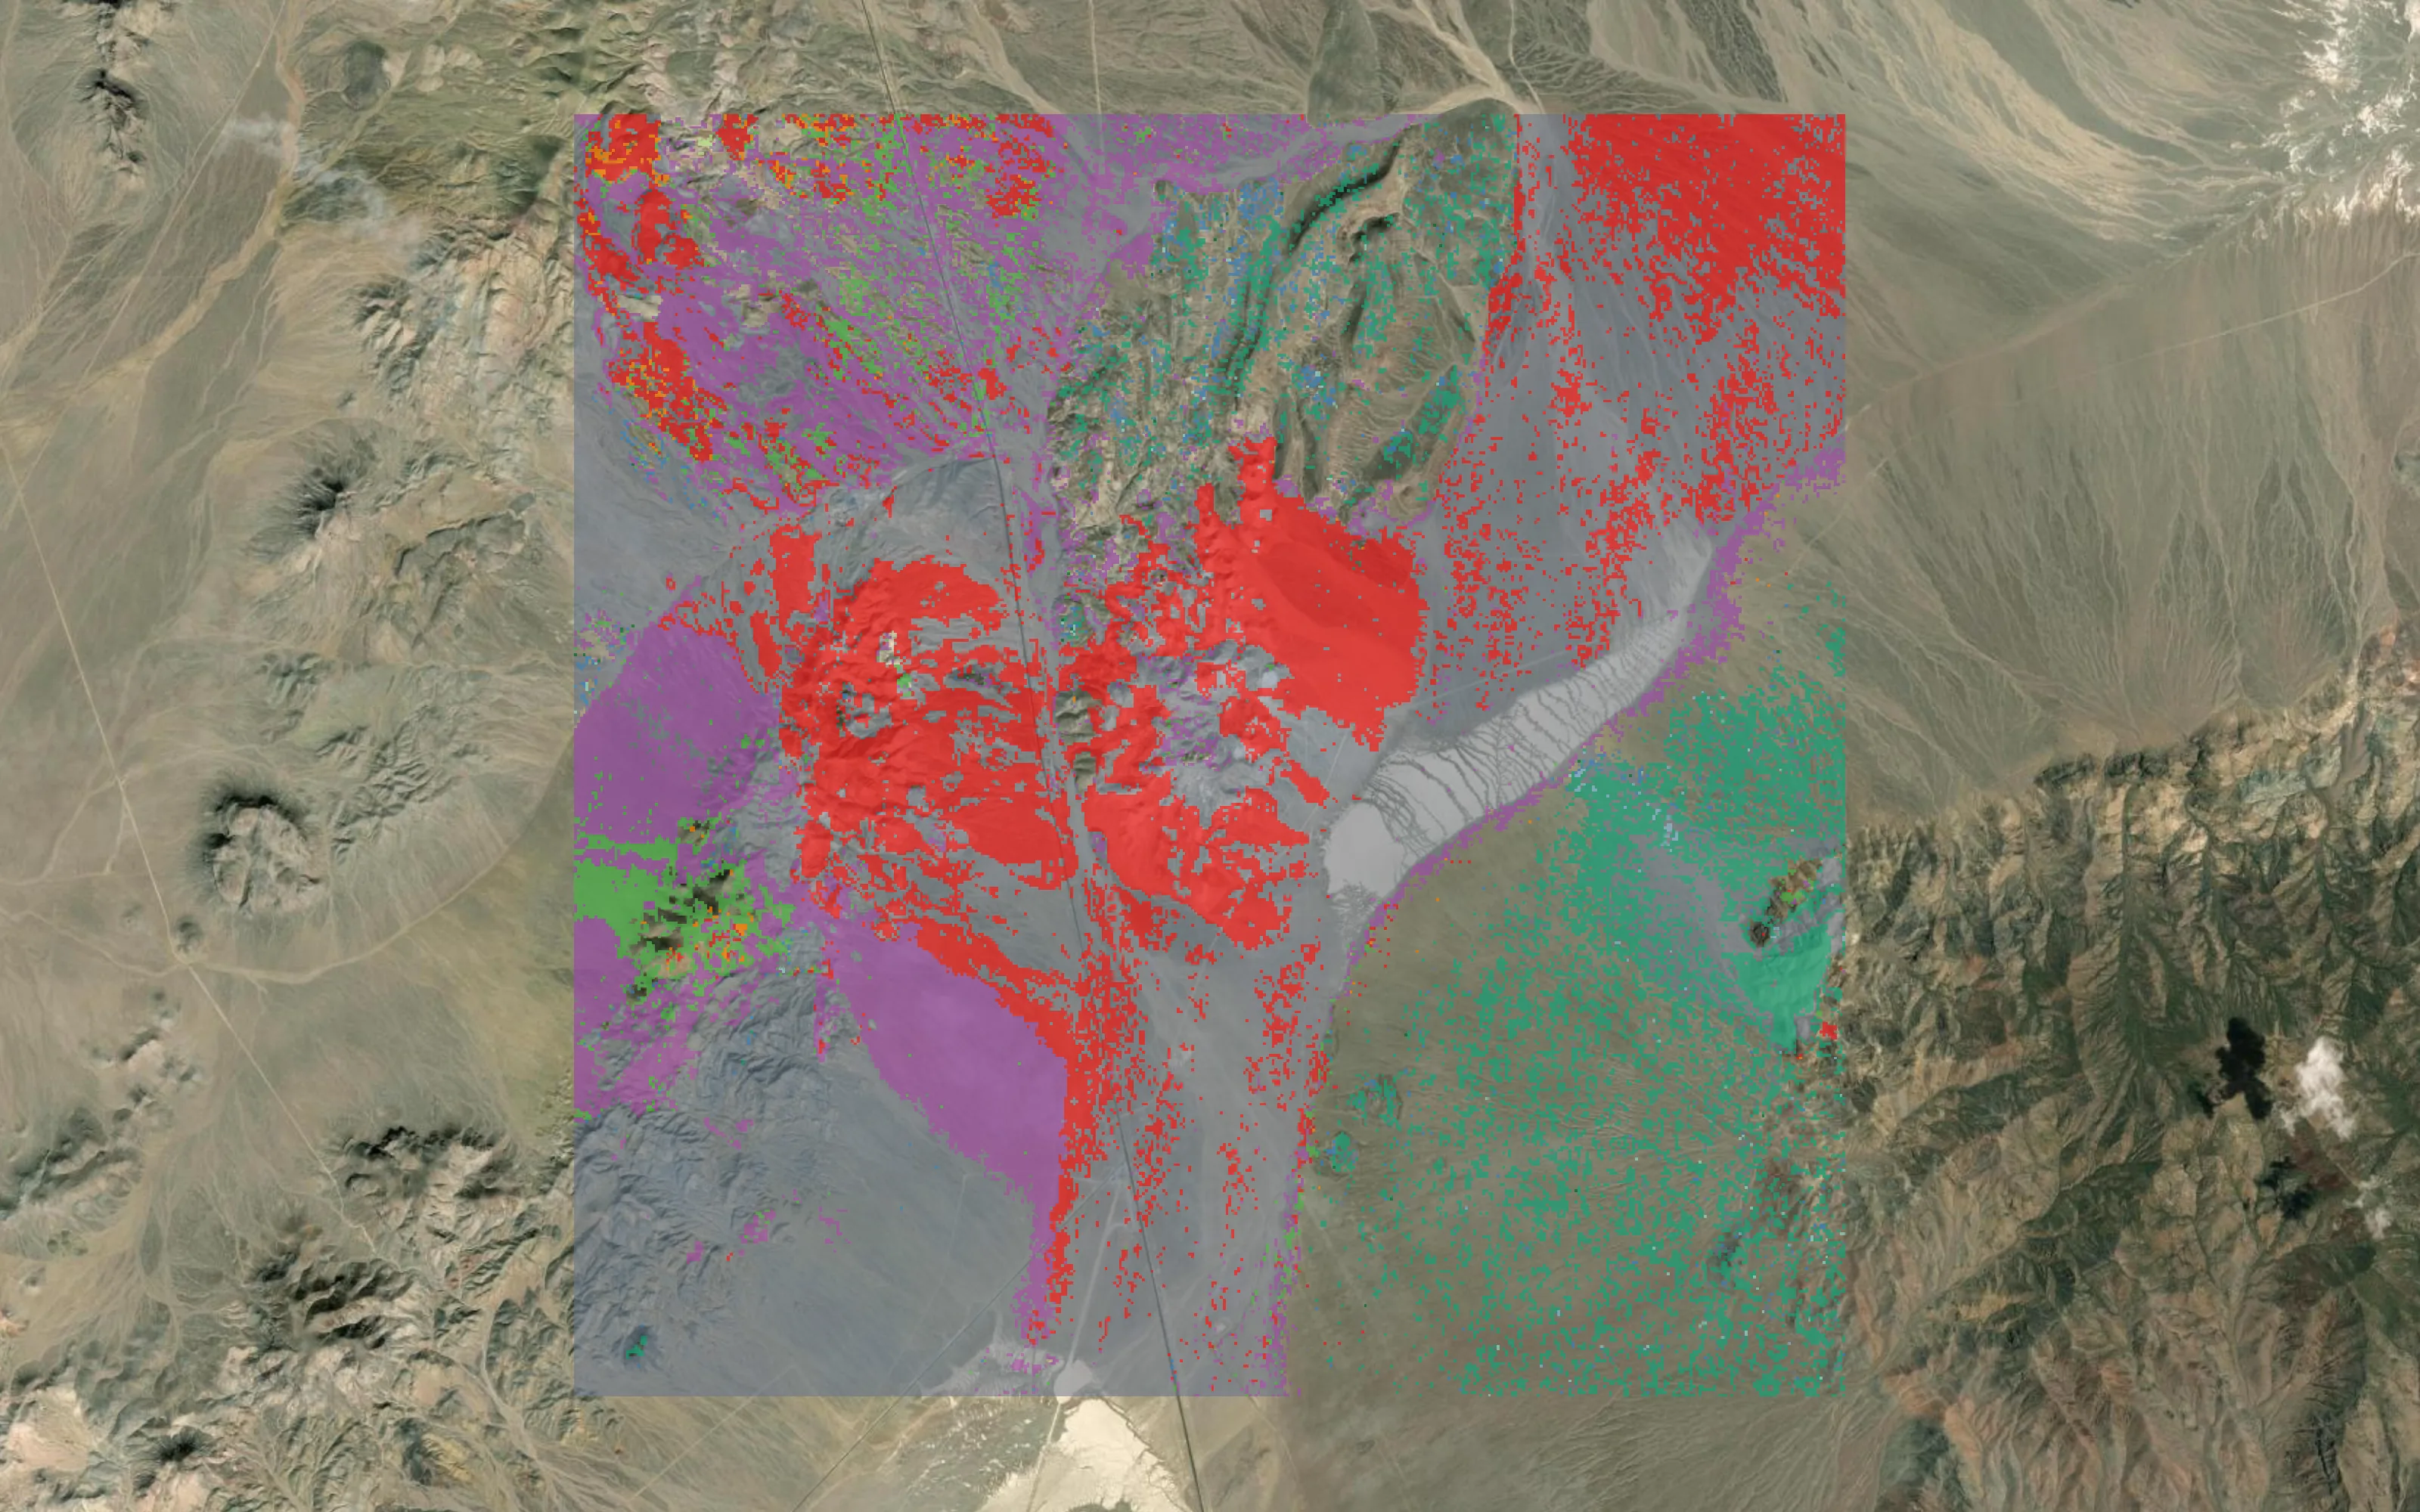
Cuprite, Nevada: alteration mineralogy from a 30 m EnMAP hyperspectral acquisition, matched against laboratory reference spectra. Cuprite is the published USGS reference site we benchmark against.































Data published by 80 organisations ·Names and logos belong to their owners; no endorsement or partnership is implied. All 80 sources
Three scales
From a province to a prospect.
Choose the scale the decision needs. Each step narrows the ground the next one has to cover.
10 to 90 m
Regional
ASTER, Sentinel-2, Landsat, EMIT
Mineral groups, iron oxides, silica and the major structures across a province or a licence package.
Choose where to look.
30 m
District
EnMAP, PRISMA
Individual alteration minerals, from alunite and pyrophyllite to chlorite and carbonate, and the zoning between them.
Find the system and read its zoning.
0.3 to 3.7 m
Camp
WorldView-3, Pléiades Neo, airborne surveys and LiDAR
Mineral groups, veins, dykes, faults and rock boundaries at the scale of a prospect.
Put field teams on the right outcrop.
Our spectral projects are delivered with GeoSpectra, from free imagery to commercial camp-scale acquisitions.
Talk to usThe approach
A colour composite is an interpretation. A spectral match is a measurement.
Each pixel's absorption features are fitted against laboratory reference spectra, with thresholds calibrated per instrument. Every clean acquisition is compared: a class that flips between passes is noise and is withheld, and ground that matches nothing stays unmatched.
- 30 m
- Hyperspectral
- EnMAP and PRISMA; EMIT at 60 m; airborne surveys finer
- 1.2 m
- Camp scale
- WorldView-3 in the visible and near infrared, 3.7 m in the shortwave infrared; Pléiades Neo at 0.3 m for structure
- 11
- Mineral families
- Each mapped on its own evidence
- 489 million
- Drill-core spectra
- Raw spectra from 6,546 scanned holes in the national core library
The review
An interactive review that works offline.
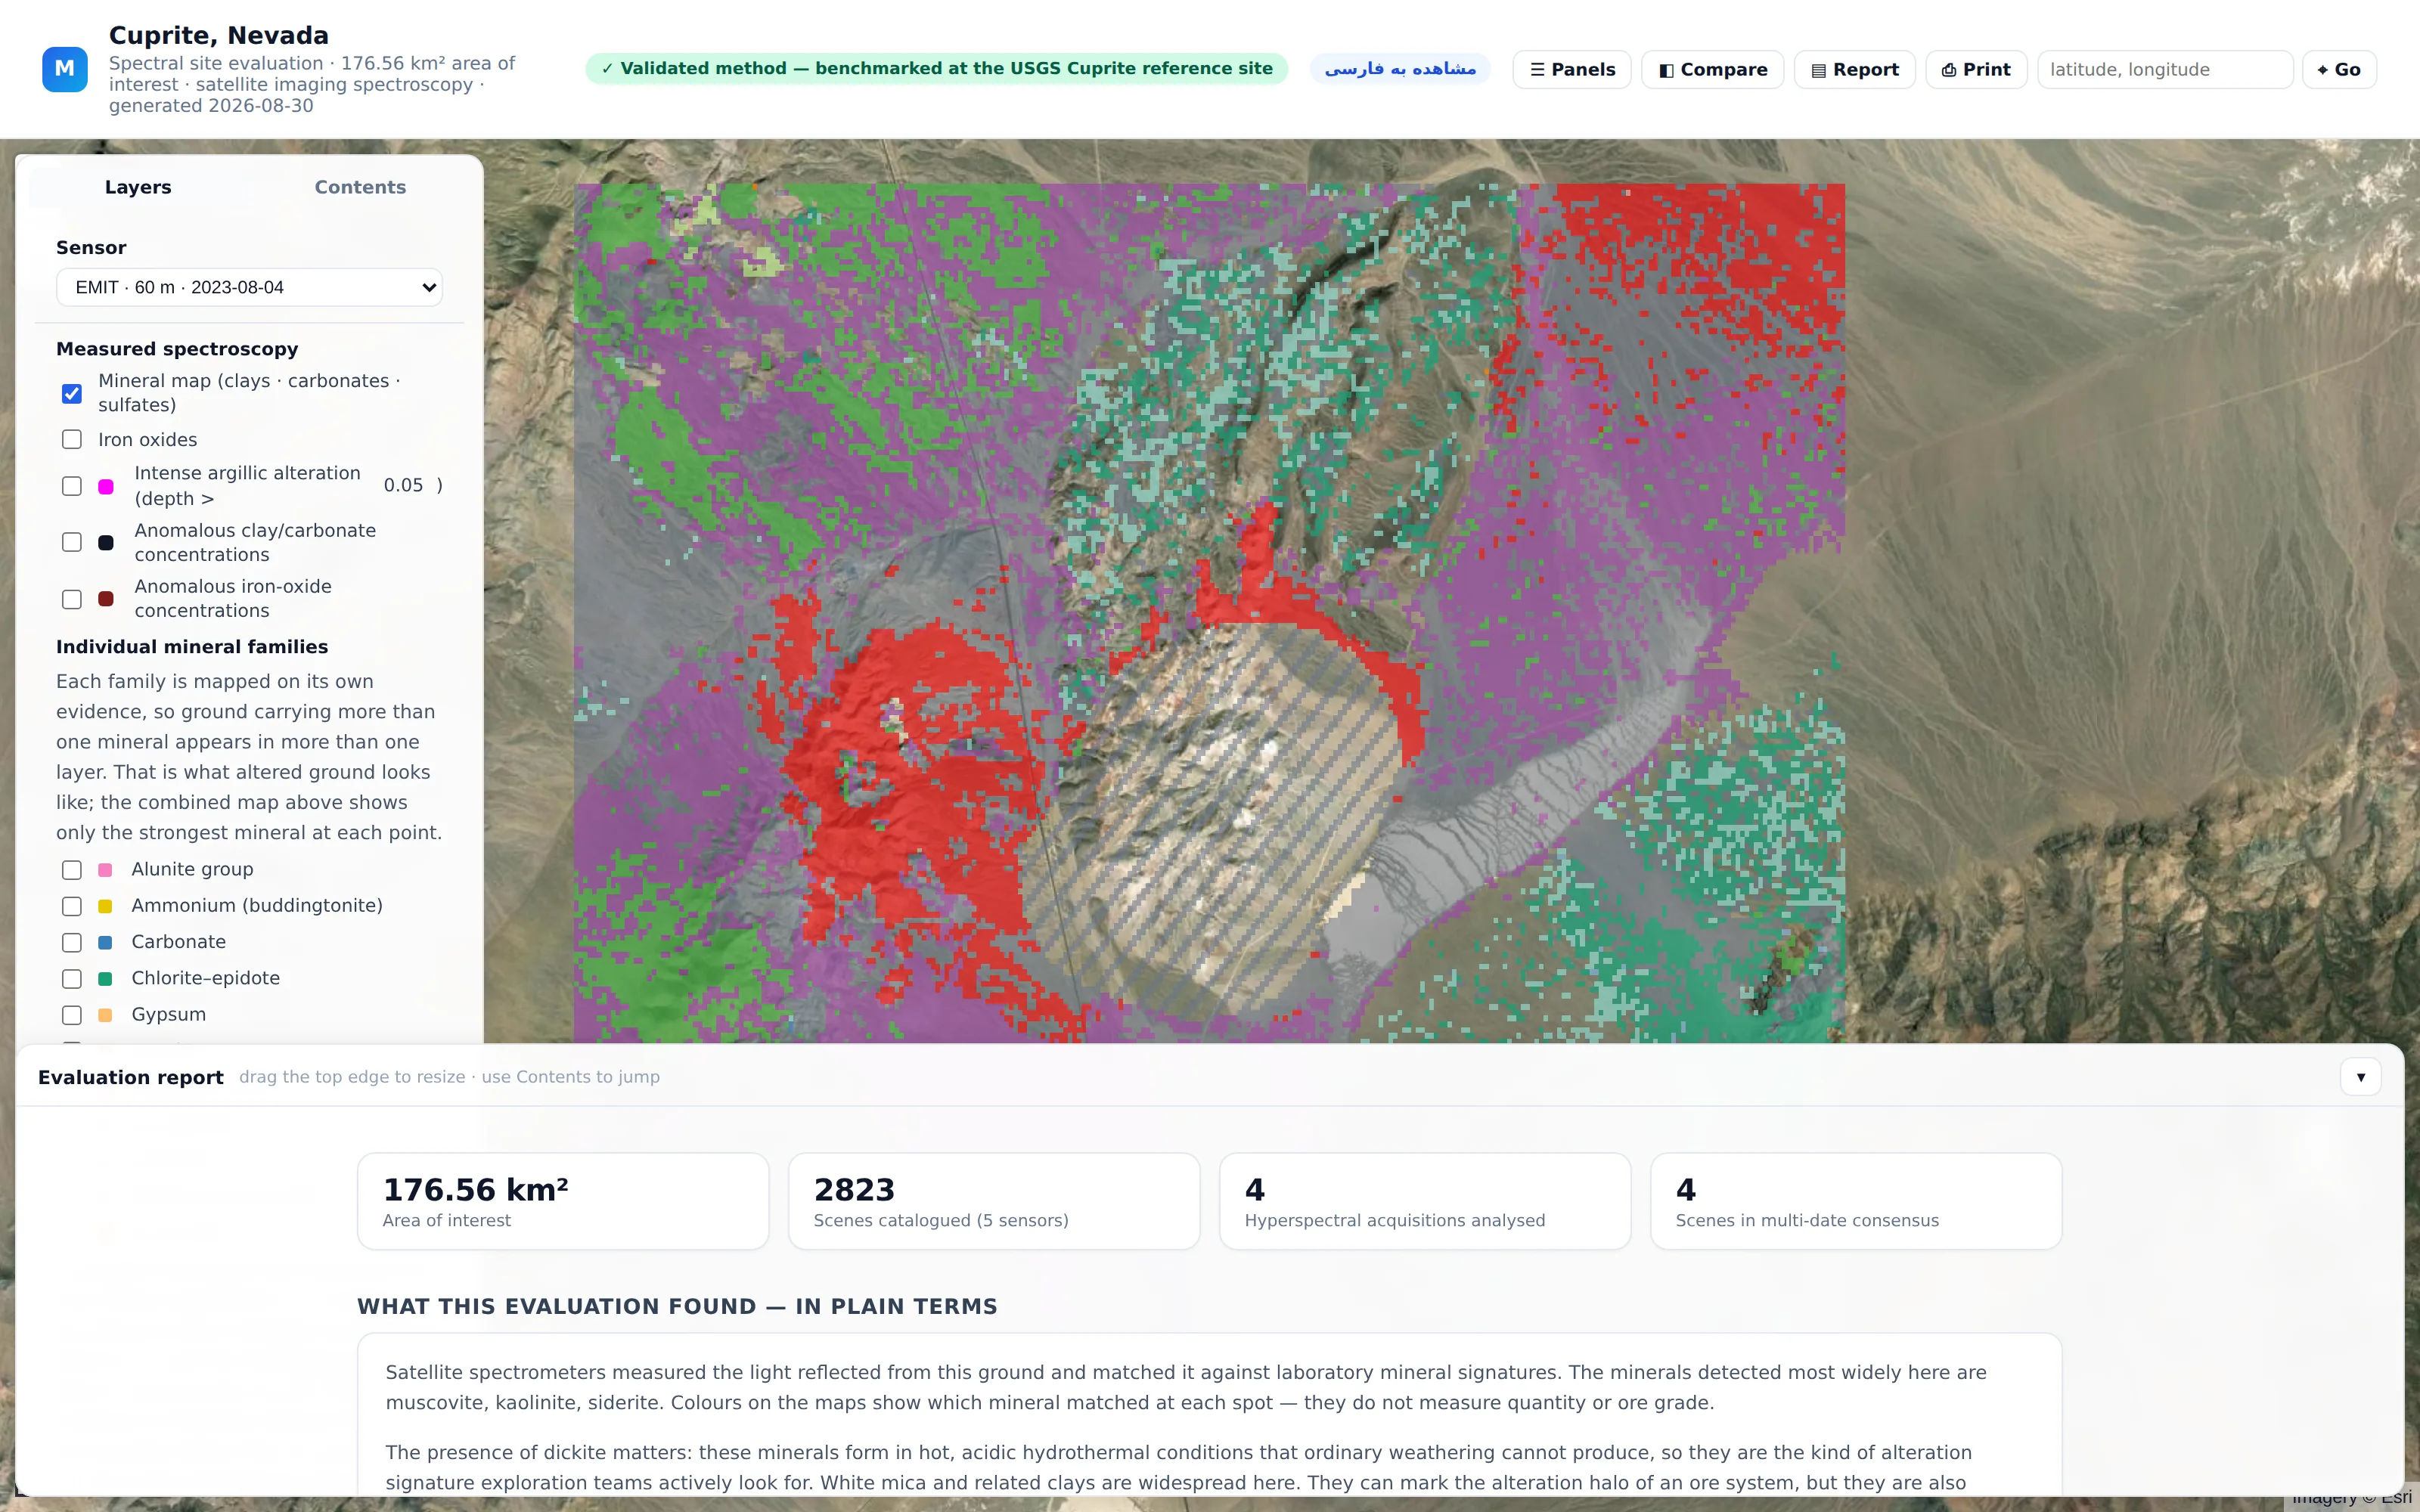
Every mineral layer, natural colour, a drawing tool for the geologist's own interpretation and the written evaluation beside the map, in a folder that opens on any laptop in the field.
What it produces
The output.
What the engine produces, in formats a GIS and a geologist can both open.
Mineral maps by family
Each family at two intensities, detected and strong, as GIS-ready rasters.
Alteration layers as vectors
One layer per mineral assemblage, ready for the geology, drill collars and tenure.
Structure and rock boundaries
Faults, lineaments and contacts, with the sense of movement where the imagery resolves it.
Imagery and composites
Natural colour and mineral composites; at camp scale, a 0.3 m base image.
An integrated target map
Combined with your geology, geochemistry and geophysics: first and second priority areas for field follow-up.
An offline review and a written report
The interactive review, a plain-language report, and every layer as data.
Read more: the mineral families we map, and what they point to
Colours on our maps show which mineral matched at each place. They do not measure quantity or grade: the geology is in the pattern.
Alunite group
Acid-sulphate alteration, formed in hot, acidic hydrothermal fluids.
Kaolinite group
Argillic alteration. Kaolinite also forms by weathering; dickite does not.
Pyrophyllite
High-temperature, advanced argillic alteration.
White mica
Phyllic (sericitic) halos, and a common rock-forming mineral, so pattern matters more than extent.
Smectite
Argillic alteration and weathering.
Chlorite and epidote
Propylitic alteration: the cooler, outer halo of many systems.
Carbonate
Carbonate alteration and carbonate host rocks.
Iron oxides
Oxidised sulphides and gossans, and red soils, which is why context matters.
Jarosite
Acid oxidation of sulphides.
Gypsum
Sulphate: evaporites and acid alteration.
Ammonium (buddingtonite)
Ammonium feldspar in some hot-spring systems.
Silica
From thermal infrared, reported as a lithological quartz signal and not as an alteration claim.
Instruments
Every acquisition over the ground, searched.
Every free acquisition over the area is catalogued first, with coverage and cloud measured, and only the instruments that can resolve the minerals in question are used. At camp scale, commercial imagery is acquired for the project.
| Instrument | Type | Pixel | Range | Used for |
|---|---|---|---|---|
| EnMAP | Hyperspectral satellite | 30 m | 0.42 to 2.45 µm | Clays, micas, carbonates, sulphates, chlorite and epidote, iron |
| PRISMA | Hyperspectral satellite | 30 m | 0.40 to 2.50 µm | As EnMAP; archive acquisitions ordered per project |
| EMIT | Imaging spectrometer, International Space Station | 60 m | 0.38 to 2.50 µm | Broad mineral families over large areas |
| DESIS | Hyperspectral, International Space Station | 30 m | 0.40 to 1.00 µm | Iron oxides and vegetation; no shortwave clays |
| ASTER | Multispectral with thermal infrared | 15 to 90 m | VNIR · SWIR · TIR | Mineral-group ratios from the archive; silica from thermal infrared |
| Sentinel-2 | Multispectral satellite | 10 to 20 m | 0.44 to 2.19 µm | Iron-oxide indices at 10 m, and context |
| Landsat | Multispectral satellite | 30 m | 0.43 to 2.29 µm | Context and the long historical record |
| WorldView-3 | Commercial multispectral satellite, acquired per project | 1.2 m · 3.7 m | VNIR · 8 SWIR bands | Camp-scale mineral groups: clays and micas, carbonates, iron oxides |
| Pléiades Neo | Commercial satellite, acquired per project | 0.3 m | Visible to near infrared | Veins, dykes, faults and rock boundaries at prospect scale |
| Airborne | Hyperspectral surveys where they exist and are licensed | to 4.5 m | VNIR · SWIR | Detail at prospect scale |
| LiDAR | Airborne elevation, where it exists or is flown | 1 m or finer | Elevation | Faults and rock boundaries beneath vegetation |
We do not identify individual mineral species from multispectral imagery. With a handful of bands it maps indices and mineral groups reliably; naming a species needs a hyperspectral measurement. Using the wrong instrument for that claim manufactures false identifications, and we do not do it.
62
Airborne products, Queensland
Hyperspectral mineral products at 4.5 m, cleared by the Geological Survey of Queensland for use in commercial deliverables.
23 m
National airborne maps, Afghanistan
The U.S. Geological Survey's airborne hyperspectral mineral maps, over the parts of the country that were flown, public domain, and the reference for our blind test.
489 million
Drill-core spectra, Australia
From 6,546 holes in the national core library, paired to laboratory assays in 2,746 of them: what the minerals look like below the surface the satellites see.
How it is tested
Benchmarked in Nevada. Tested blind in Afghanistan.
Scored against the published expert mapping of the USGS Cuprite reference site, on acquisitions from two different instruments.
Then tested blind in Afghanistan: the rule was frozen and the predictions recorded before the second area's reference mapping was read.
Spectral remote sensing partner
Our spectral projects are delivered with GeoSpectra, from free imagery to commercial camp-scale acquisitions. Australian specialists in spectral remote sensing and geospatial intelligence for mineral exploration. Their interpretation practice sets the standard our automated pipeline is held to.
geospectra.com.au
From every acquisition to a mineral map.
- 01
Discover
Every free multispectral and hyperspectral acquisition over the area catalogued, with the usable clear fraction measured, because catalogue cloud figures under-report cirrus. At camp scale, WorldView-3 or Pléiades Neo is acquired for the project.
- 02
Hypothesis first
The mineral-system hypothesis for the ground is written down and signed before any map is made, so the map is read against it.
- 03
Match
Continuum-removed spectral feature fitting against laboratory reference libraries, with detection thresholds calibrated per instrument.
- 04
Corroborate
Families compared across every clean acquisition. Vegetation, cloud and snow masked first; disagreement withheld.
- 05
Interpret
Faults, lineaments and rock boundaries interpreted from the imagery and elevation, and read against the alteration, as context for targeting and never as a rule that picks bodies on its own.
- 06
Deliver
The offline review, the written report and the data, with every served file checked before release.
Straight talk
What this is, and what it isn't.
We would rather say less than claim more than the evidence supports.
It is
- Surface mineralogy measured from reflected light and matched against laboratory spectra
- Mapped at the scale the decision needs, from a province to a prospect
- Benchmarked against a published reference mapping, and tested blind
- Honest about limits: vegetation, cloud and snow are masked, and unmatched ground stays unmatched
It is not
- A measure of grade or quantity: colour shows which mineral matched, not how much
- Species identification from multispectral imagery
- A view below the surface: a satellite reads the uppermost skin of rock and soil
- A drilling target on its own: alteration needs structure and context
Next in the workflow · 05
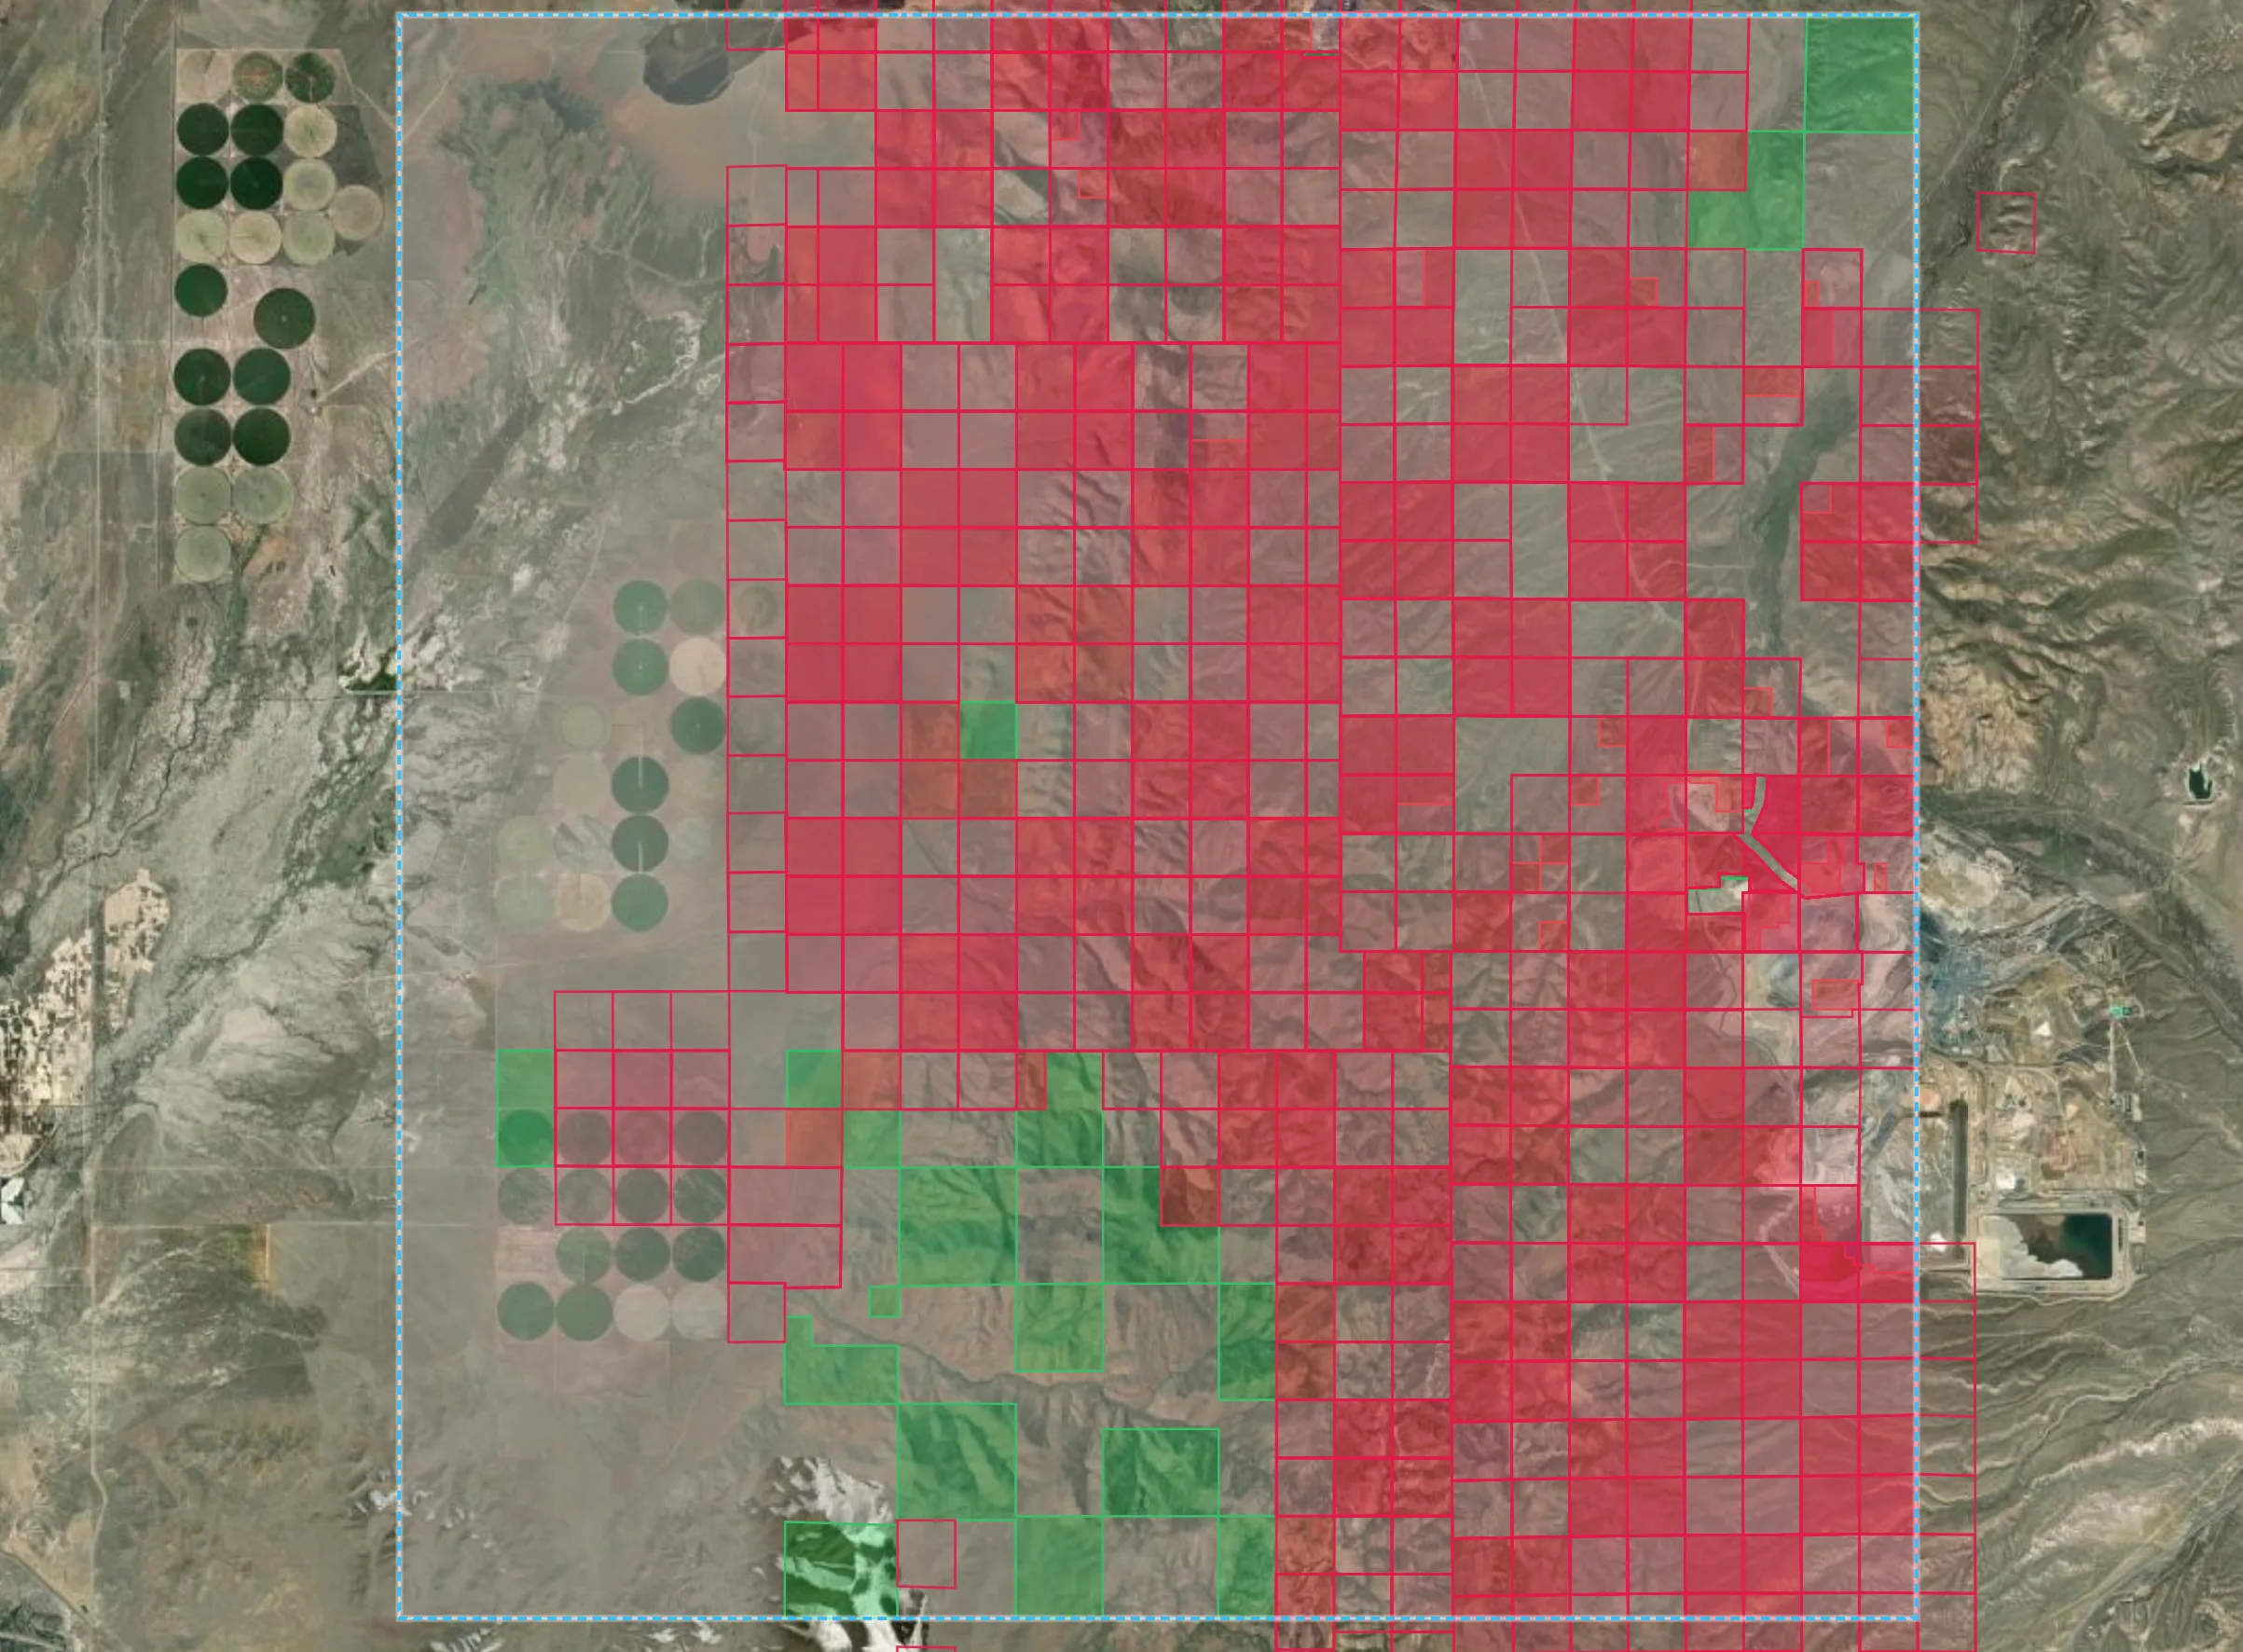
Due Diligence & Market Analysis
Can I acquire it, hold it, and what will it cost me?
Continue-
Partners
Exploration and mining companies interested in working with us.
-
Investors
The record, the models and the ground they point to.
-
Publishers and researchers
Geological surveys, universities and programmes whose work the record is built on.